Housing market data Q3/2021: Falling dynamics on the housing market

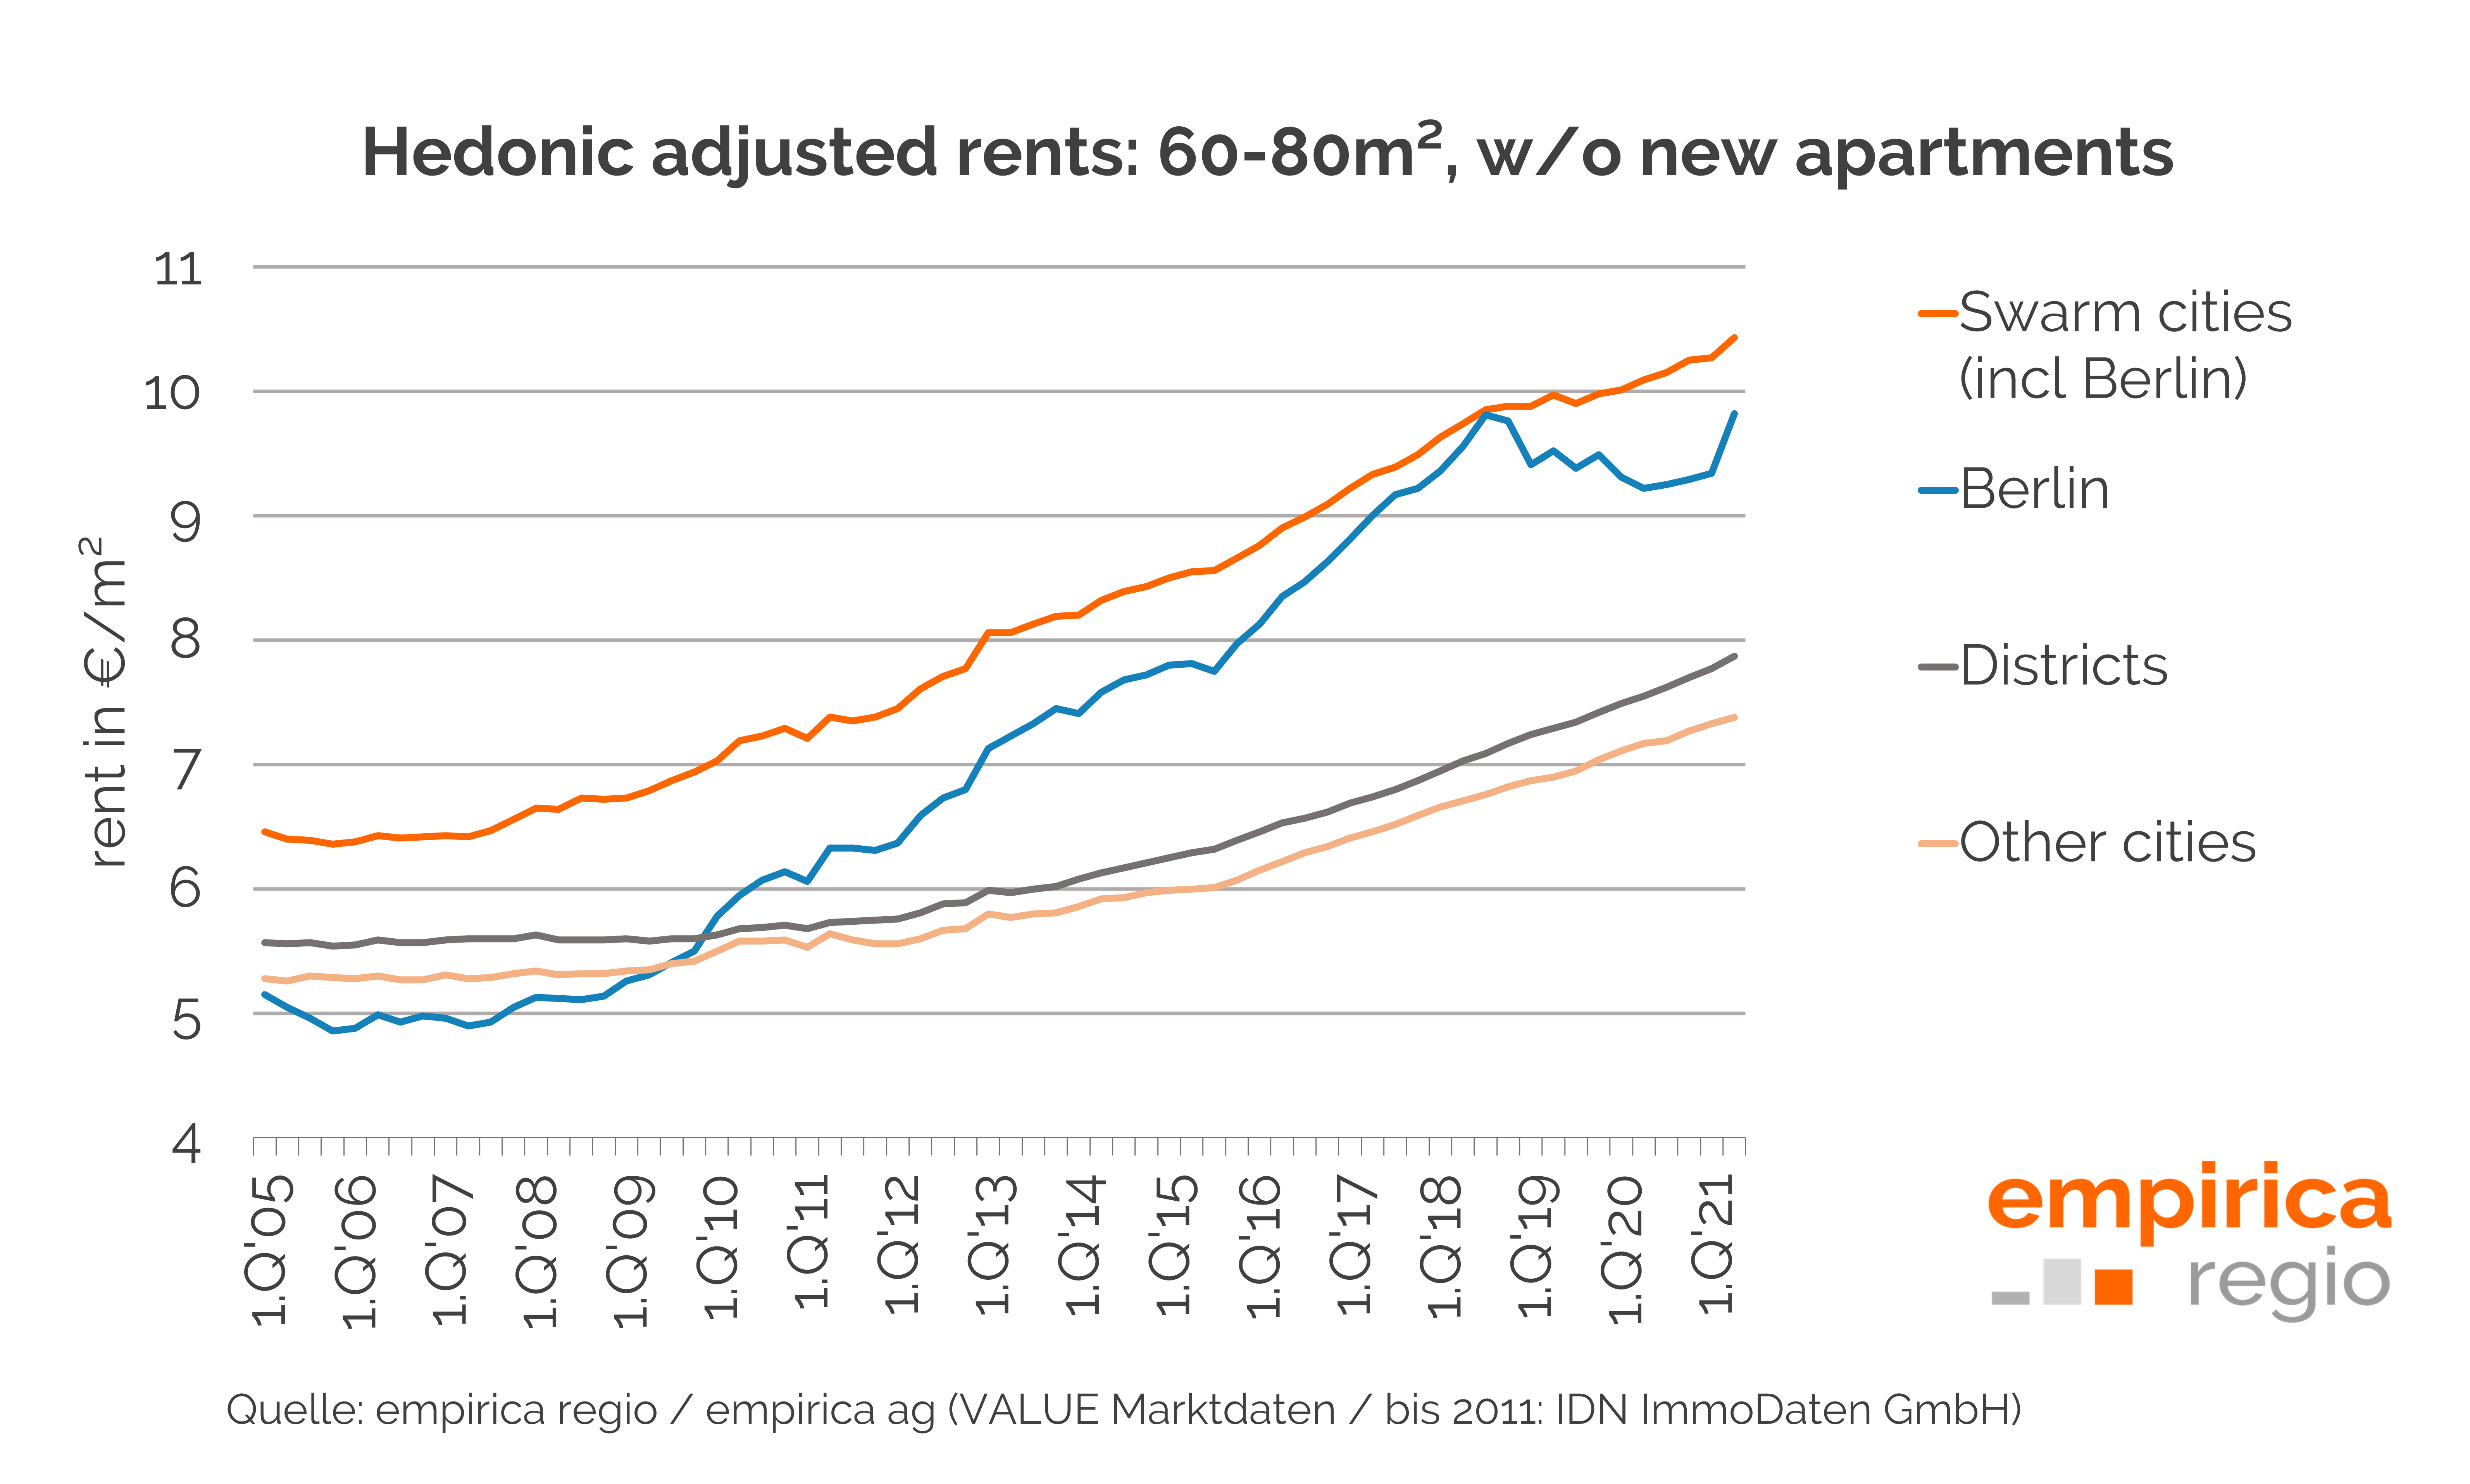
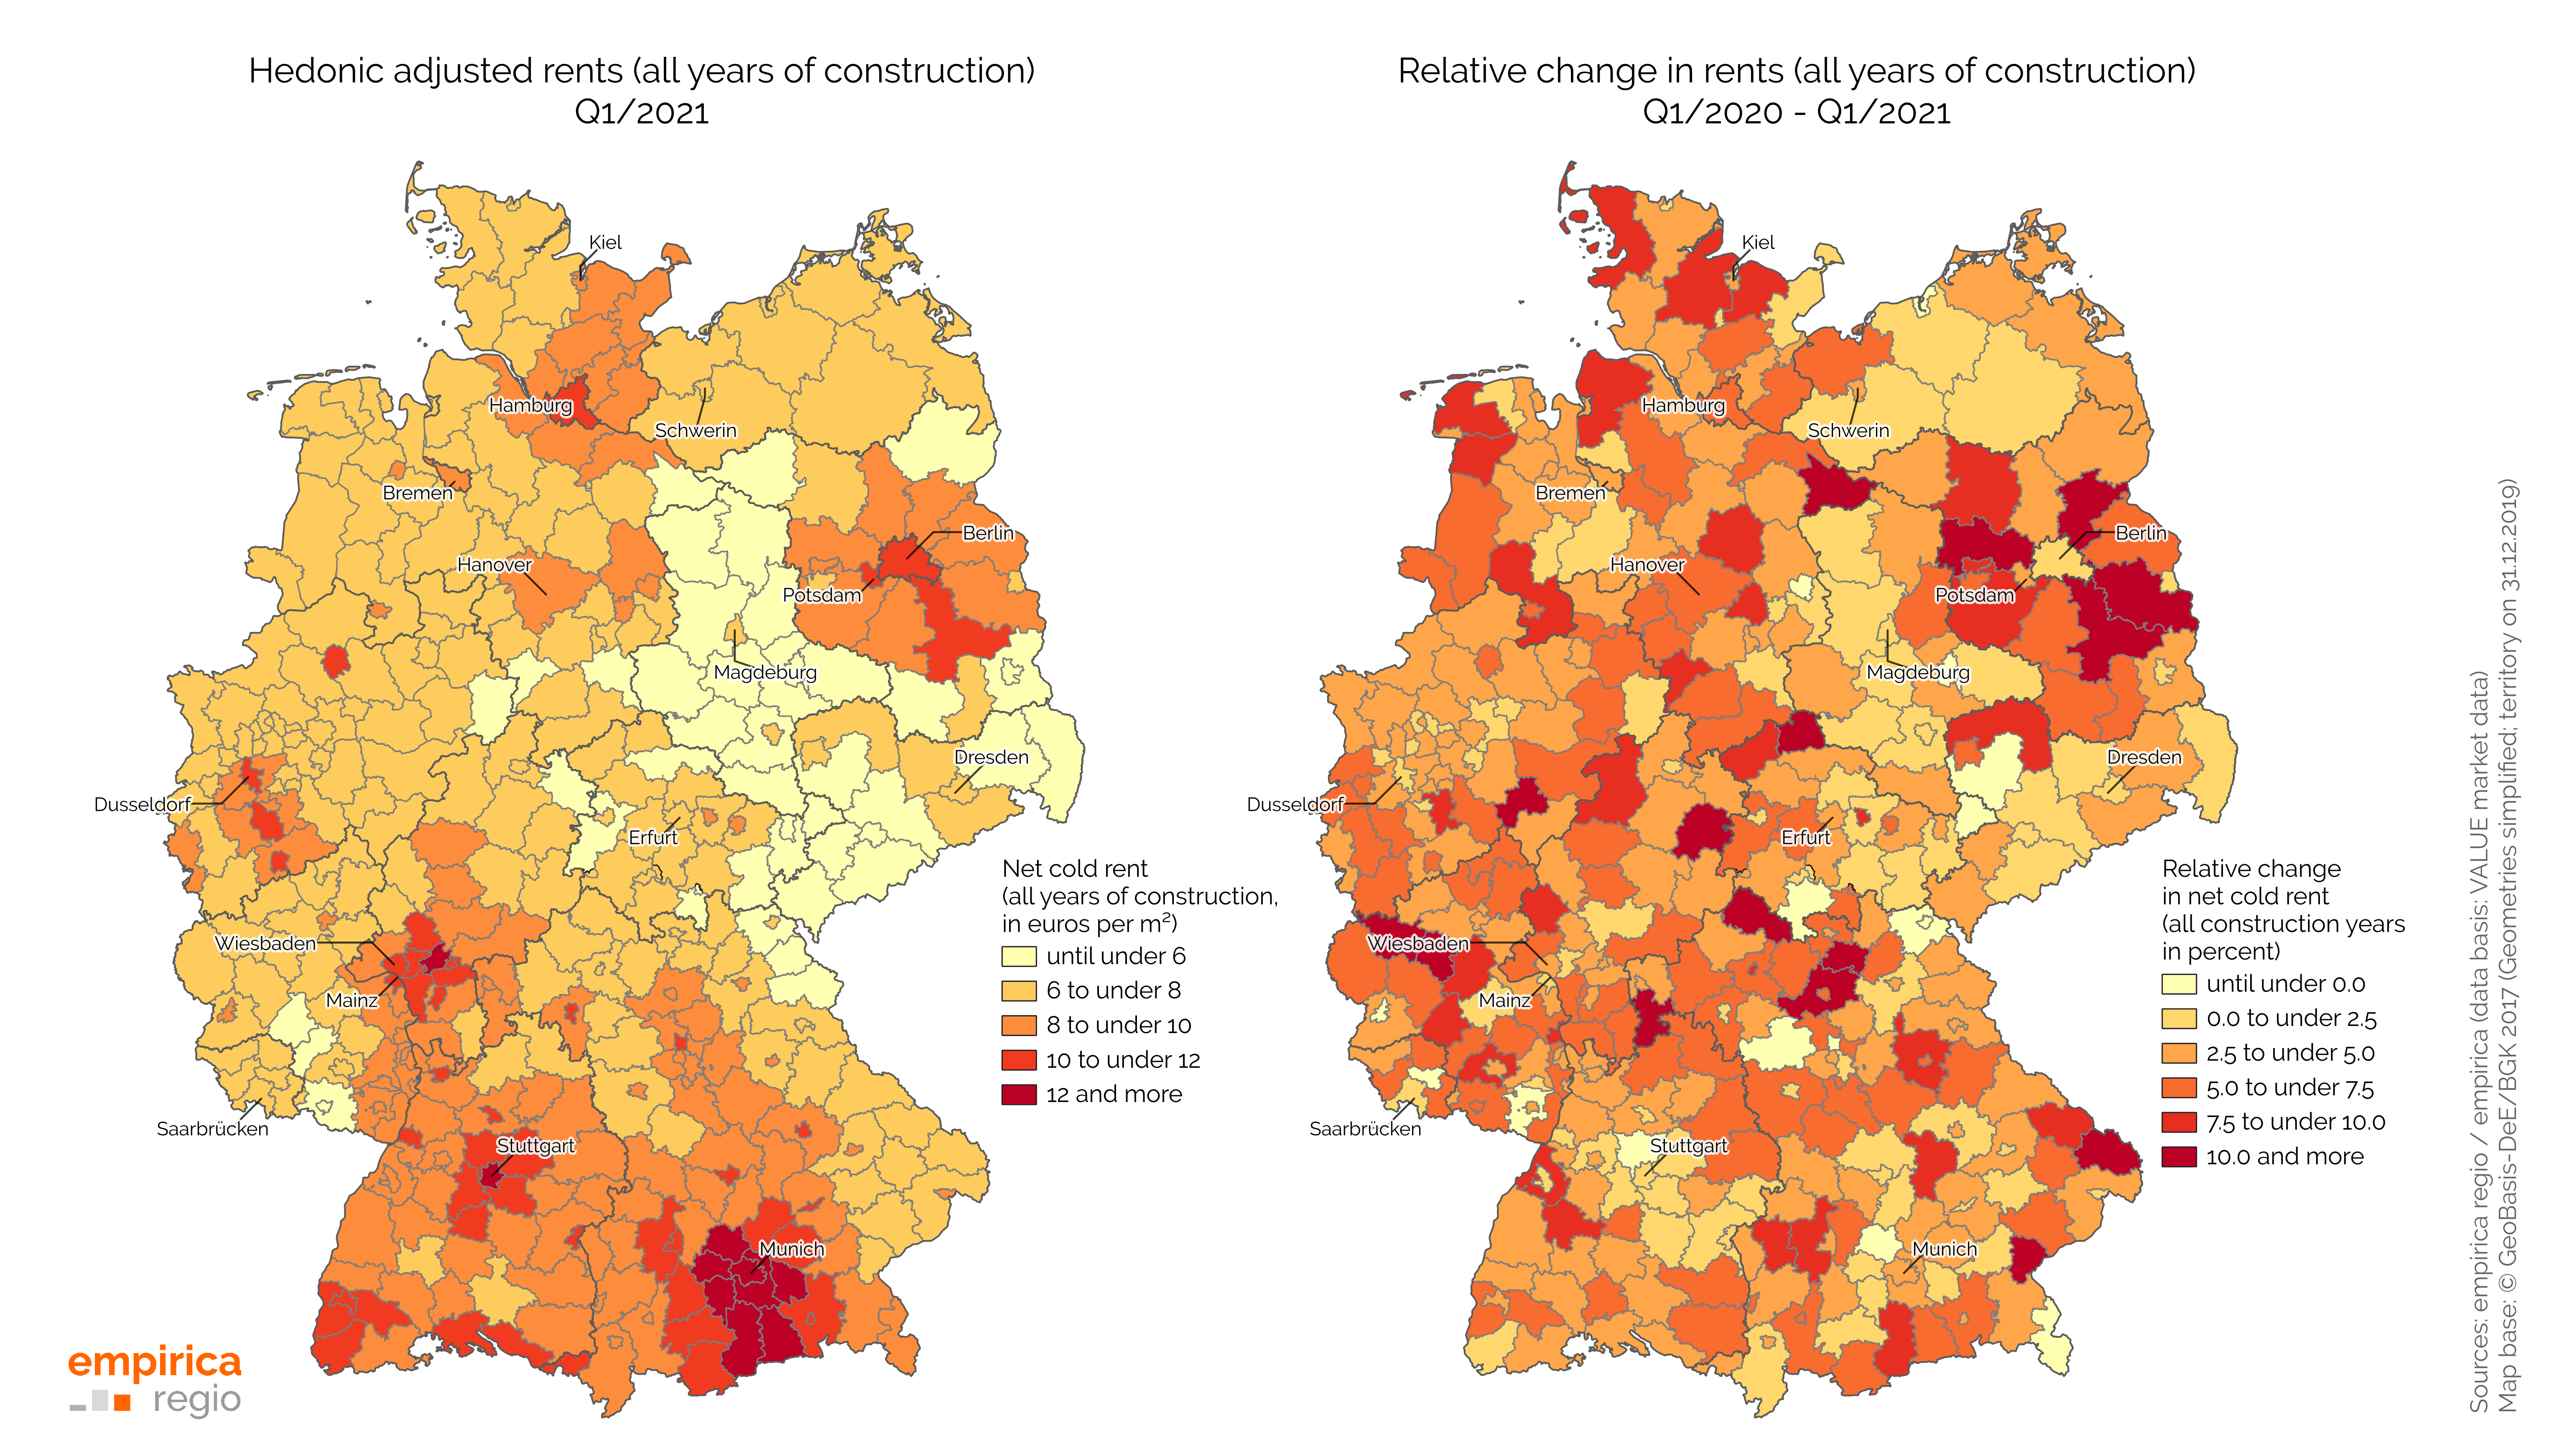
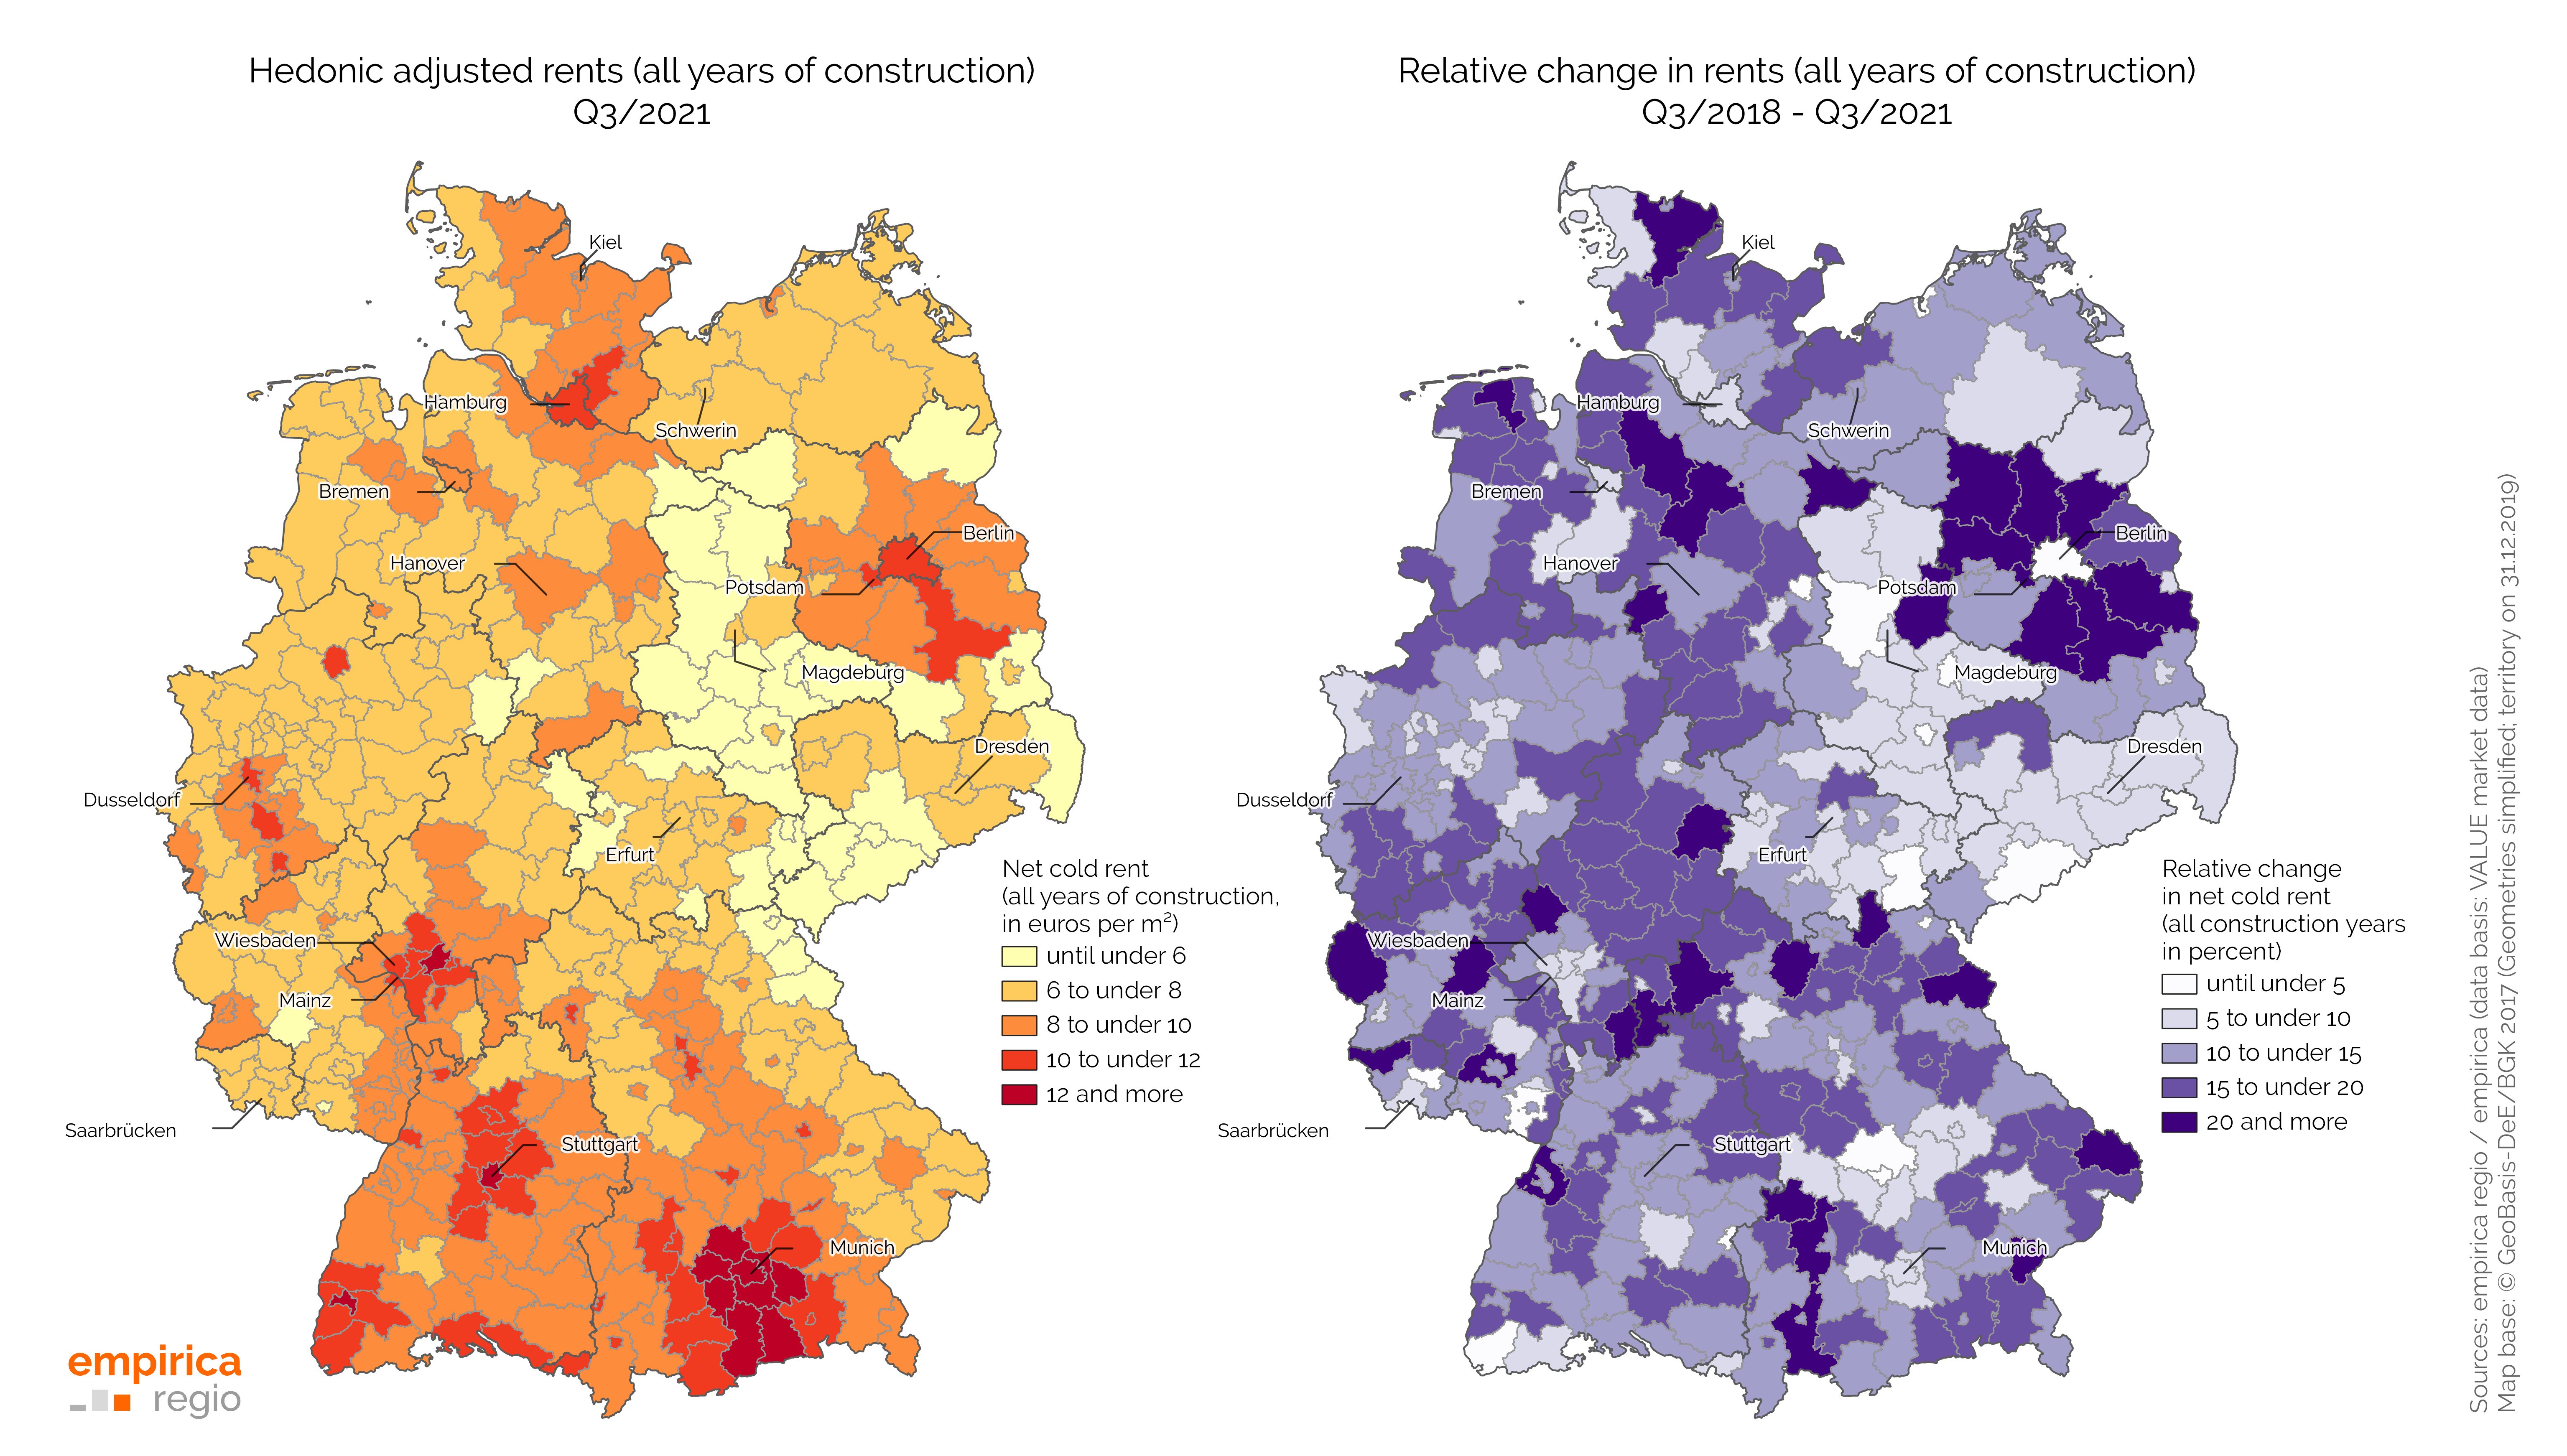
The empirica property price index for Q3 2021 is available just in time for EXPO REAL. The rise in rents in the swarm cities is easing somewhat. In the surrounding regions and some rural areas, on the other hand, rents are rising even more strongly, albeit from a lower starting level. A look at the following map shows the development of the last three years at district level for rents (all construction years). The core cities have also benefited somewhat less recently in terms of migration, and in the Corona year 2020 even lost some population through migration. We have published an analysis recently on our blog.
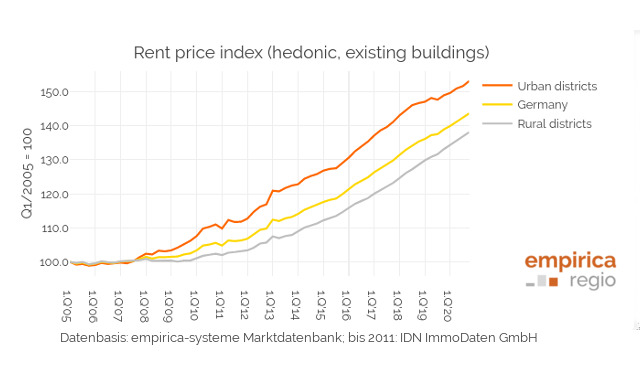
The average growth rates of purchase prices for condominiums as well as detached and semi-detached houses remain at a high level and far above the average rental price development. In one or the other segment, the purchase price curves even point downwards at times. There are increasing signs that property prices are losing momentum. Here, as with rents, a closer look at the individual housing market regions and segments is necessary.
Looking at nationwide averages is simply not enough to grasp the current market development. Observing regional property markets to prepare data-based decisions is therefore becoming increasingly important for private small investors as well as for large investors. The lower the effort, the better. With the empirica regional database and the housing market reports we offer the right product for all requirements. Further information on the latest housing market price index is available on the empirica website.