Housing Bubble Index
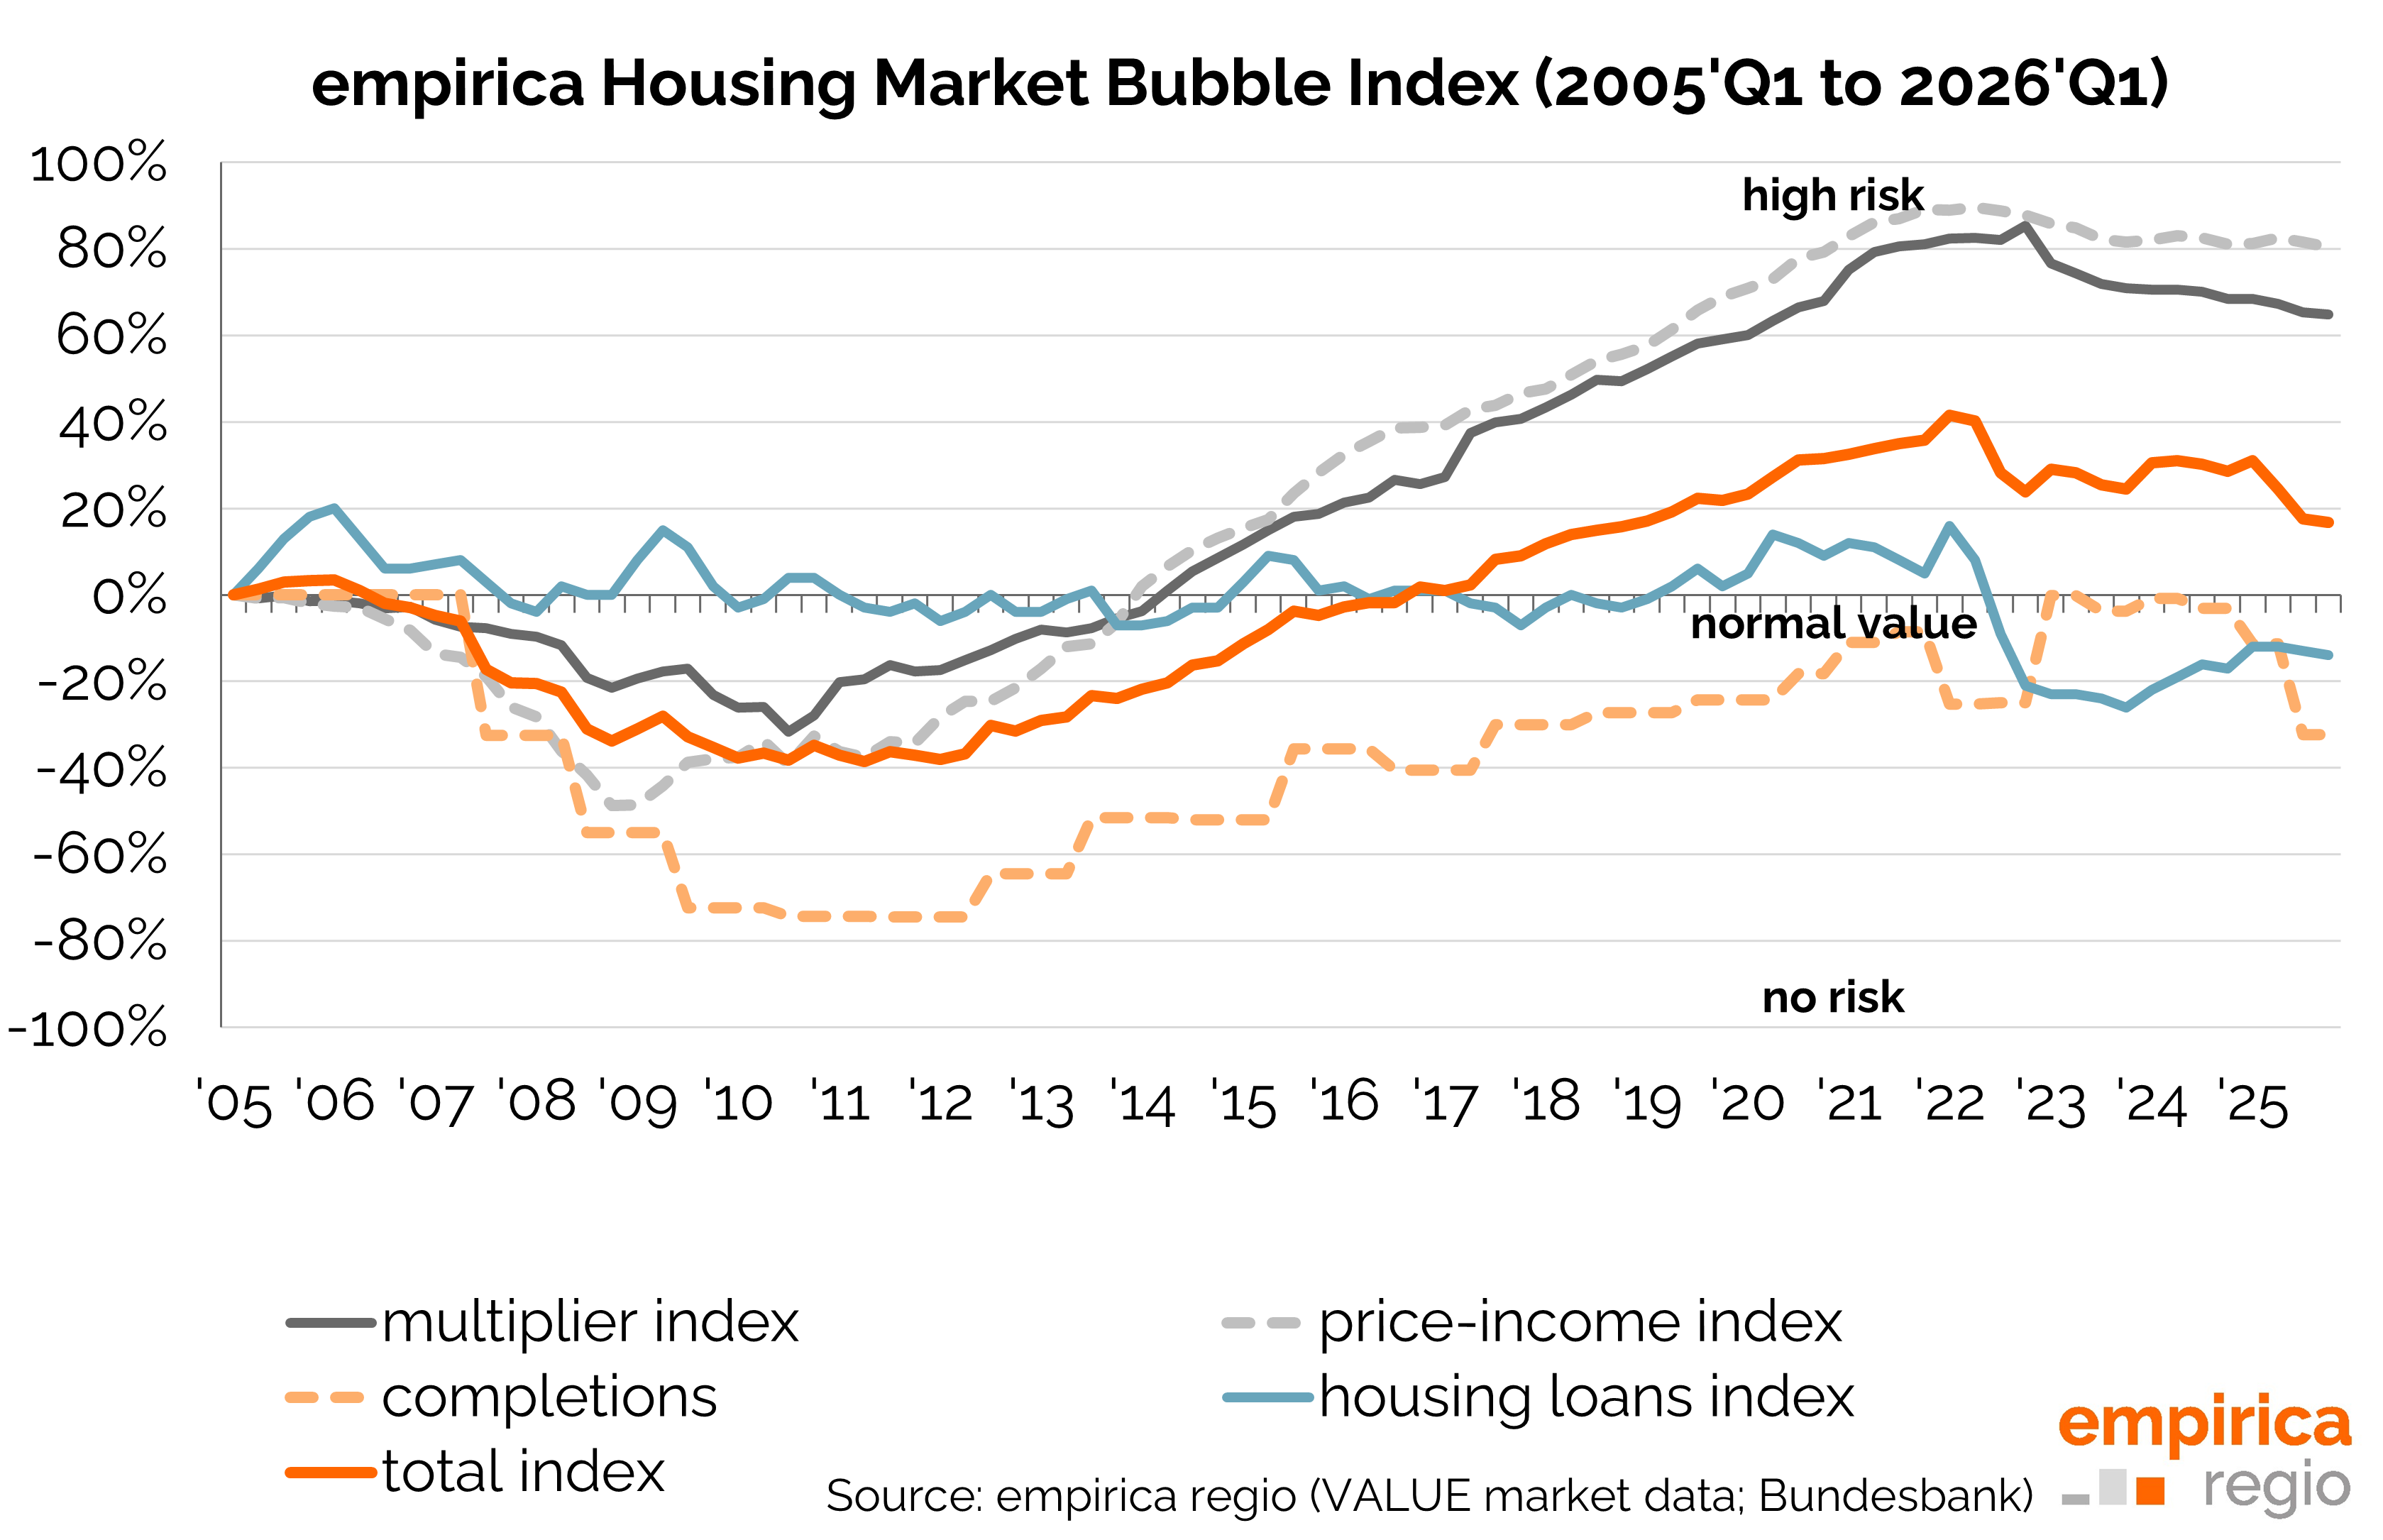
The empirica housing bubble index provides a relative risk assessment of the regional housing markets. It is based on the analysis of increases in various indicators and not on the exceeding of absolute threshold values due to the specific local characteristics.
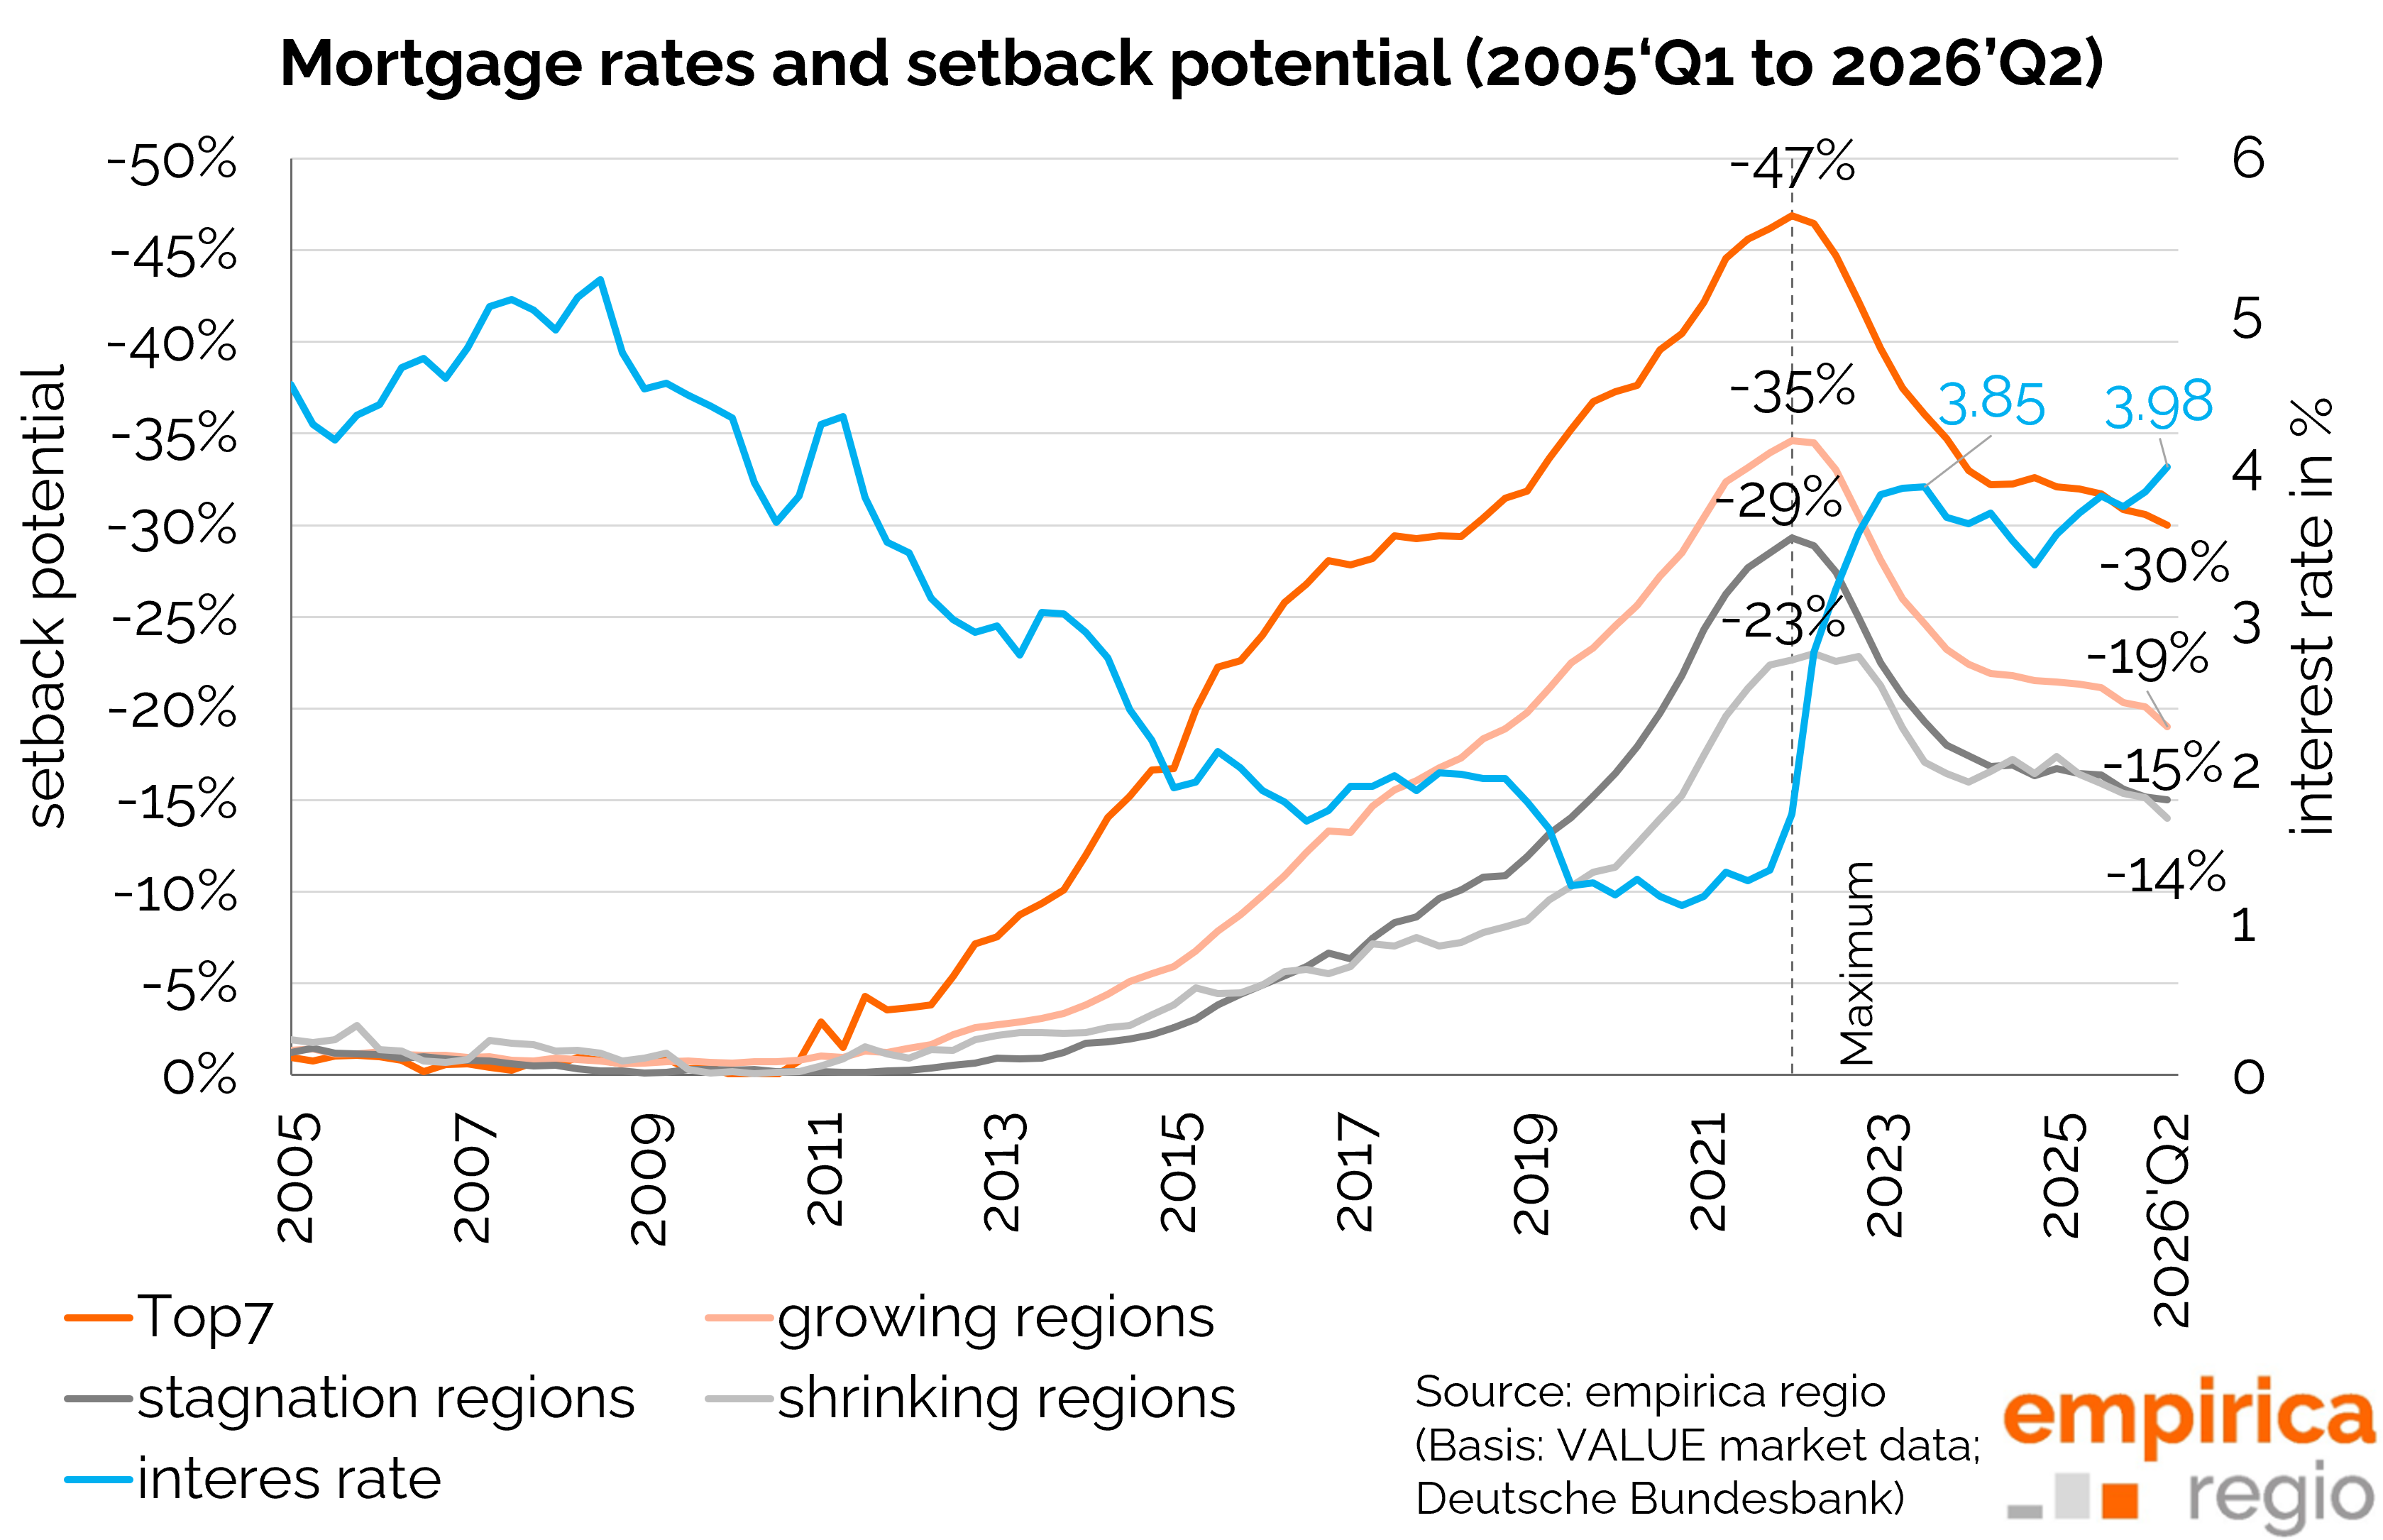
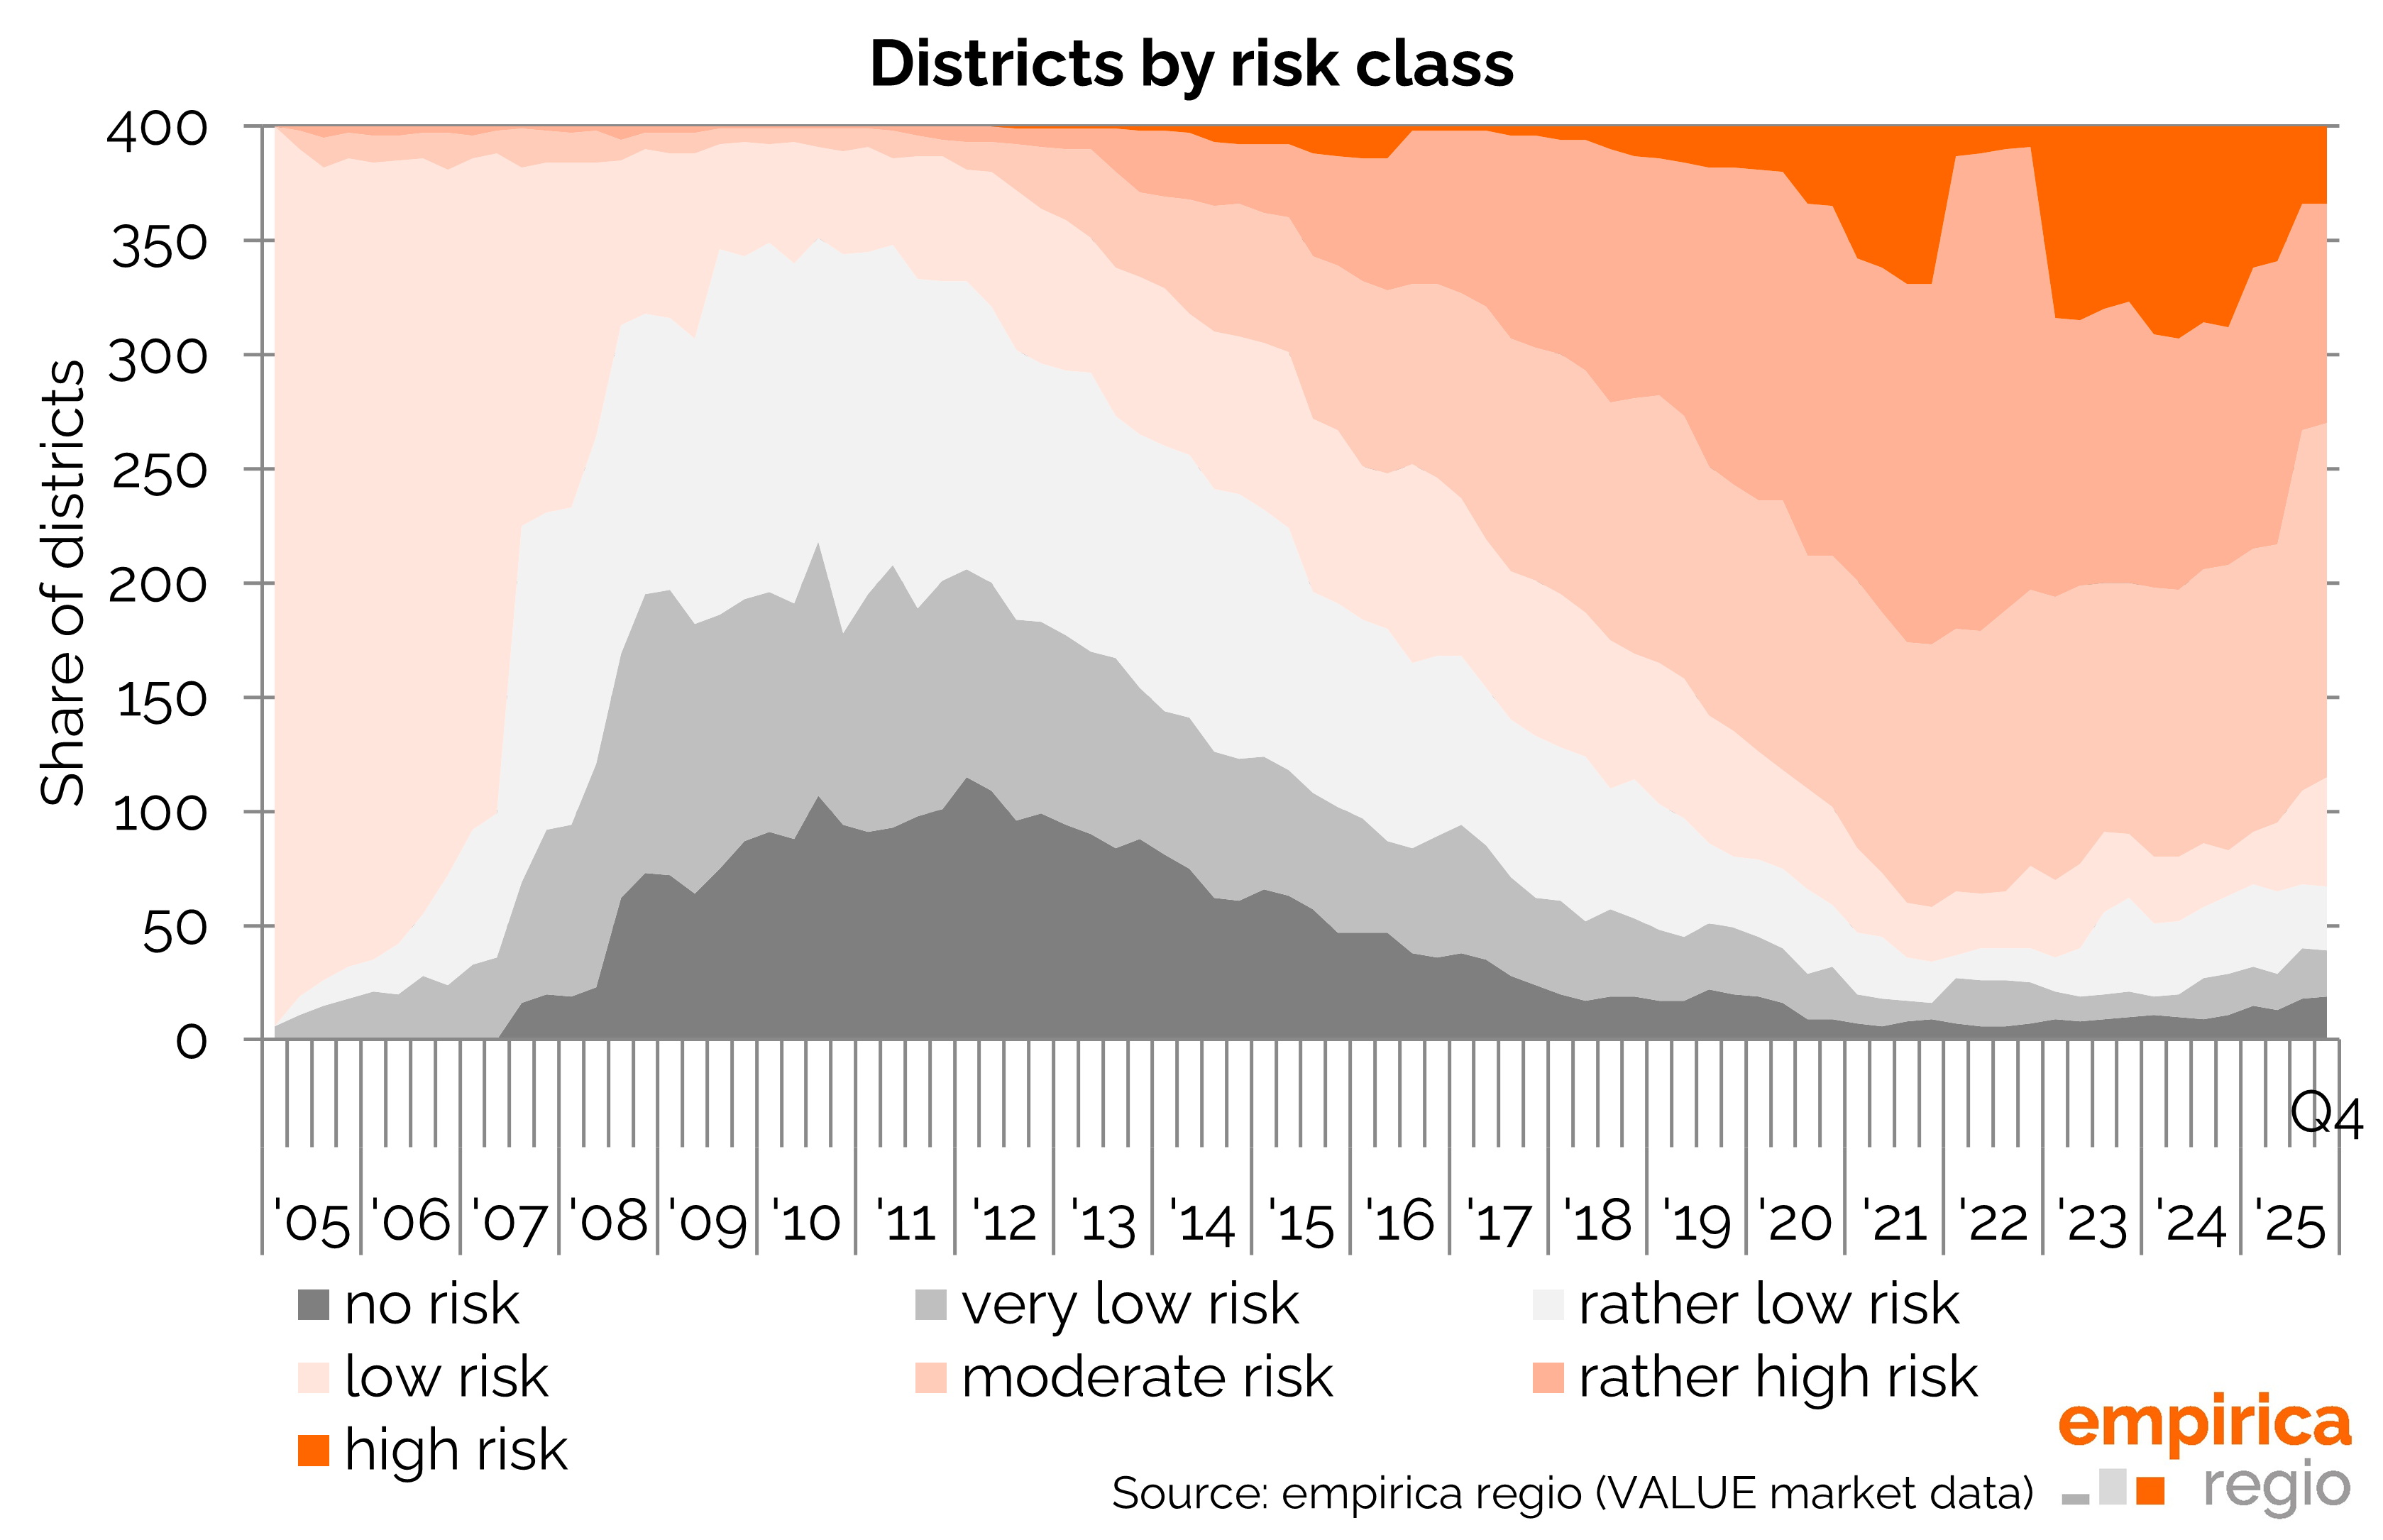
The severity of the housing market bubble risk continues to ease slightly: the rebound potential now stands at just 18% nationwide (Q2/2025: 20%, Q2/2023: 24%), and at 30% in the top 7 cities. This is driven by the ongoing rise in rents, which is underpinning purchase prices. The spread of the bubble risk is also easing slightly (-1 point), yet still affects 272 of 400 districts with moderate to high risk.
Purchase Options
Are you interested in the empirica housing bubble index? You can obtain the data at district level from empirica regio as access to the empirica Regional Database (Market Studio and RESTful API ). In addition to access to the empirica housing bubble index, you benefit from a wide range of other data. You also get immediate access to the updated index as soon as it is published.
If you are interested in a consultation appointment or an individual offer to obtain the empirica housing bubble index, please contact us by e-mail at info@empirica-regio.de or under +49 (0) 30 884 795 55.
Revision 2025
For Q3 2025, we have conducted a fundamental revision of the empirica housing price index , which also has an impact on the empirica housing bubble index. In particular, this changes the multiplier and price-income sub-indices of the empirica housing bubble index. The new values are no longer comparable with the previous calculations. Therefore, the entire time series from 2005 onwards has been revised. Only these revised data should be used for temporal analyses.
Methodology
A bubble is a speculative price increase that can no longer be justified by the fundamental relationship between supply and demand. However, it is not so much the high prices themselves that are harmful, but rather the resulting exaggerated scarcity. This leads to misallocations: housing construction and the lending required for it are boosted excessively, and capital for alternative investments becomes scarce. However, a bubble only becomes dangerous when it bursts. Assets are then destroyed because the book values of the properties lose value. Vacancies arise and, in the worst case, a banking crisis occurs because loan defaults get out of hand.
The empirica housing bubble index can only indicate the threat of a bubble forming and display various warning levels. For the calculation, the three individual indicators - multiplier, price income and construction activity - are monitored on a quarterly basis. The (regional) risk of a property bubble increases if the corresponding comparative values from 2005 or the demand forecast are significantly exceeded. The year 2005 represents a normal phase in which nobody suspected a price bubble and the market was slightly undervalued.
Detailed results and further information on the methodology can be downloaded here: