Vacancies and Vacancy Forecast
At the end of 2024, the German housing market had a total vacancy of 1.7 million dwellings (vacancy rate: 4.0%). The structural composition is striking: only around 40% of the vacant stock (671,000 dwellings) is active on the market, whilst 60% is classified as ‘other vacant stock’ (e.g. ruins or dysfunctional properties). The available actual figures cover the period up to 2024; the new forecast begins with the base year 2024 and covers the forecast period from 2025 to 2045.
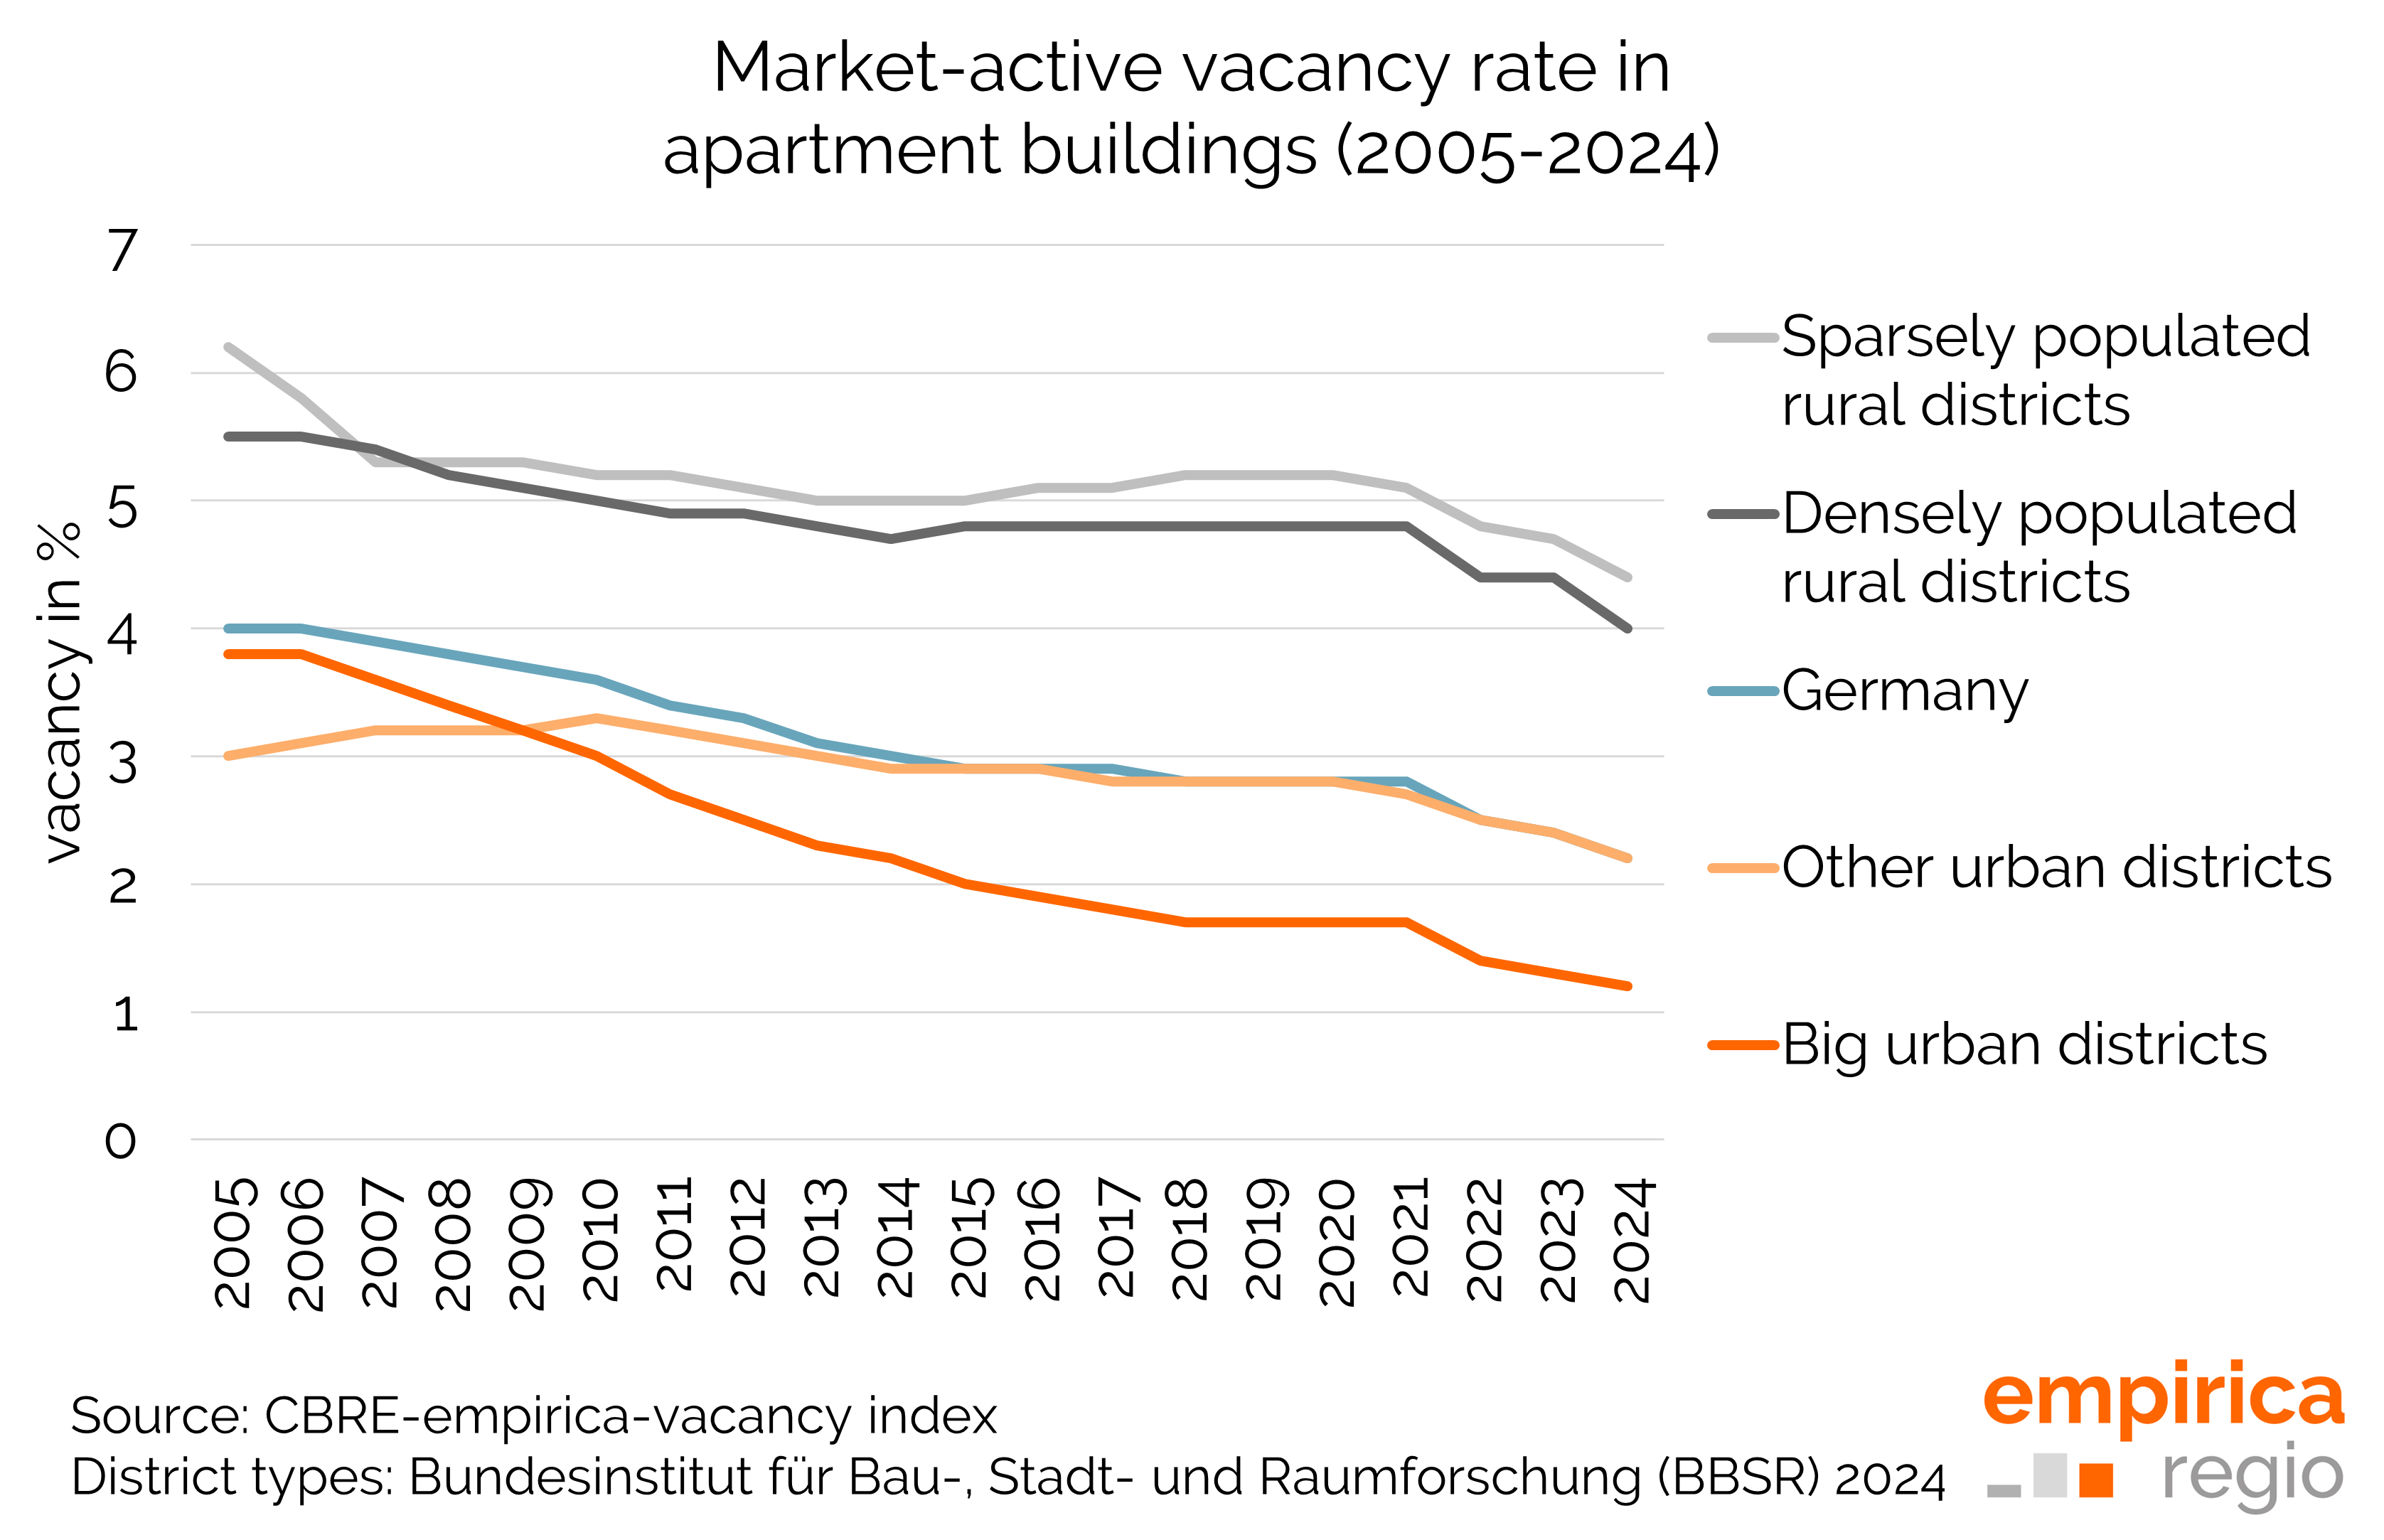
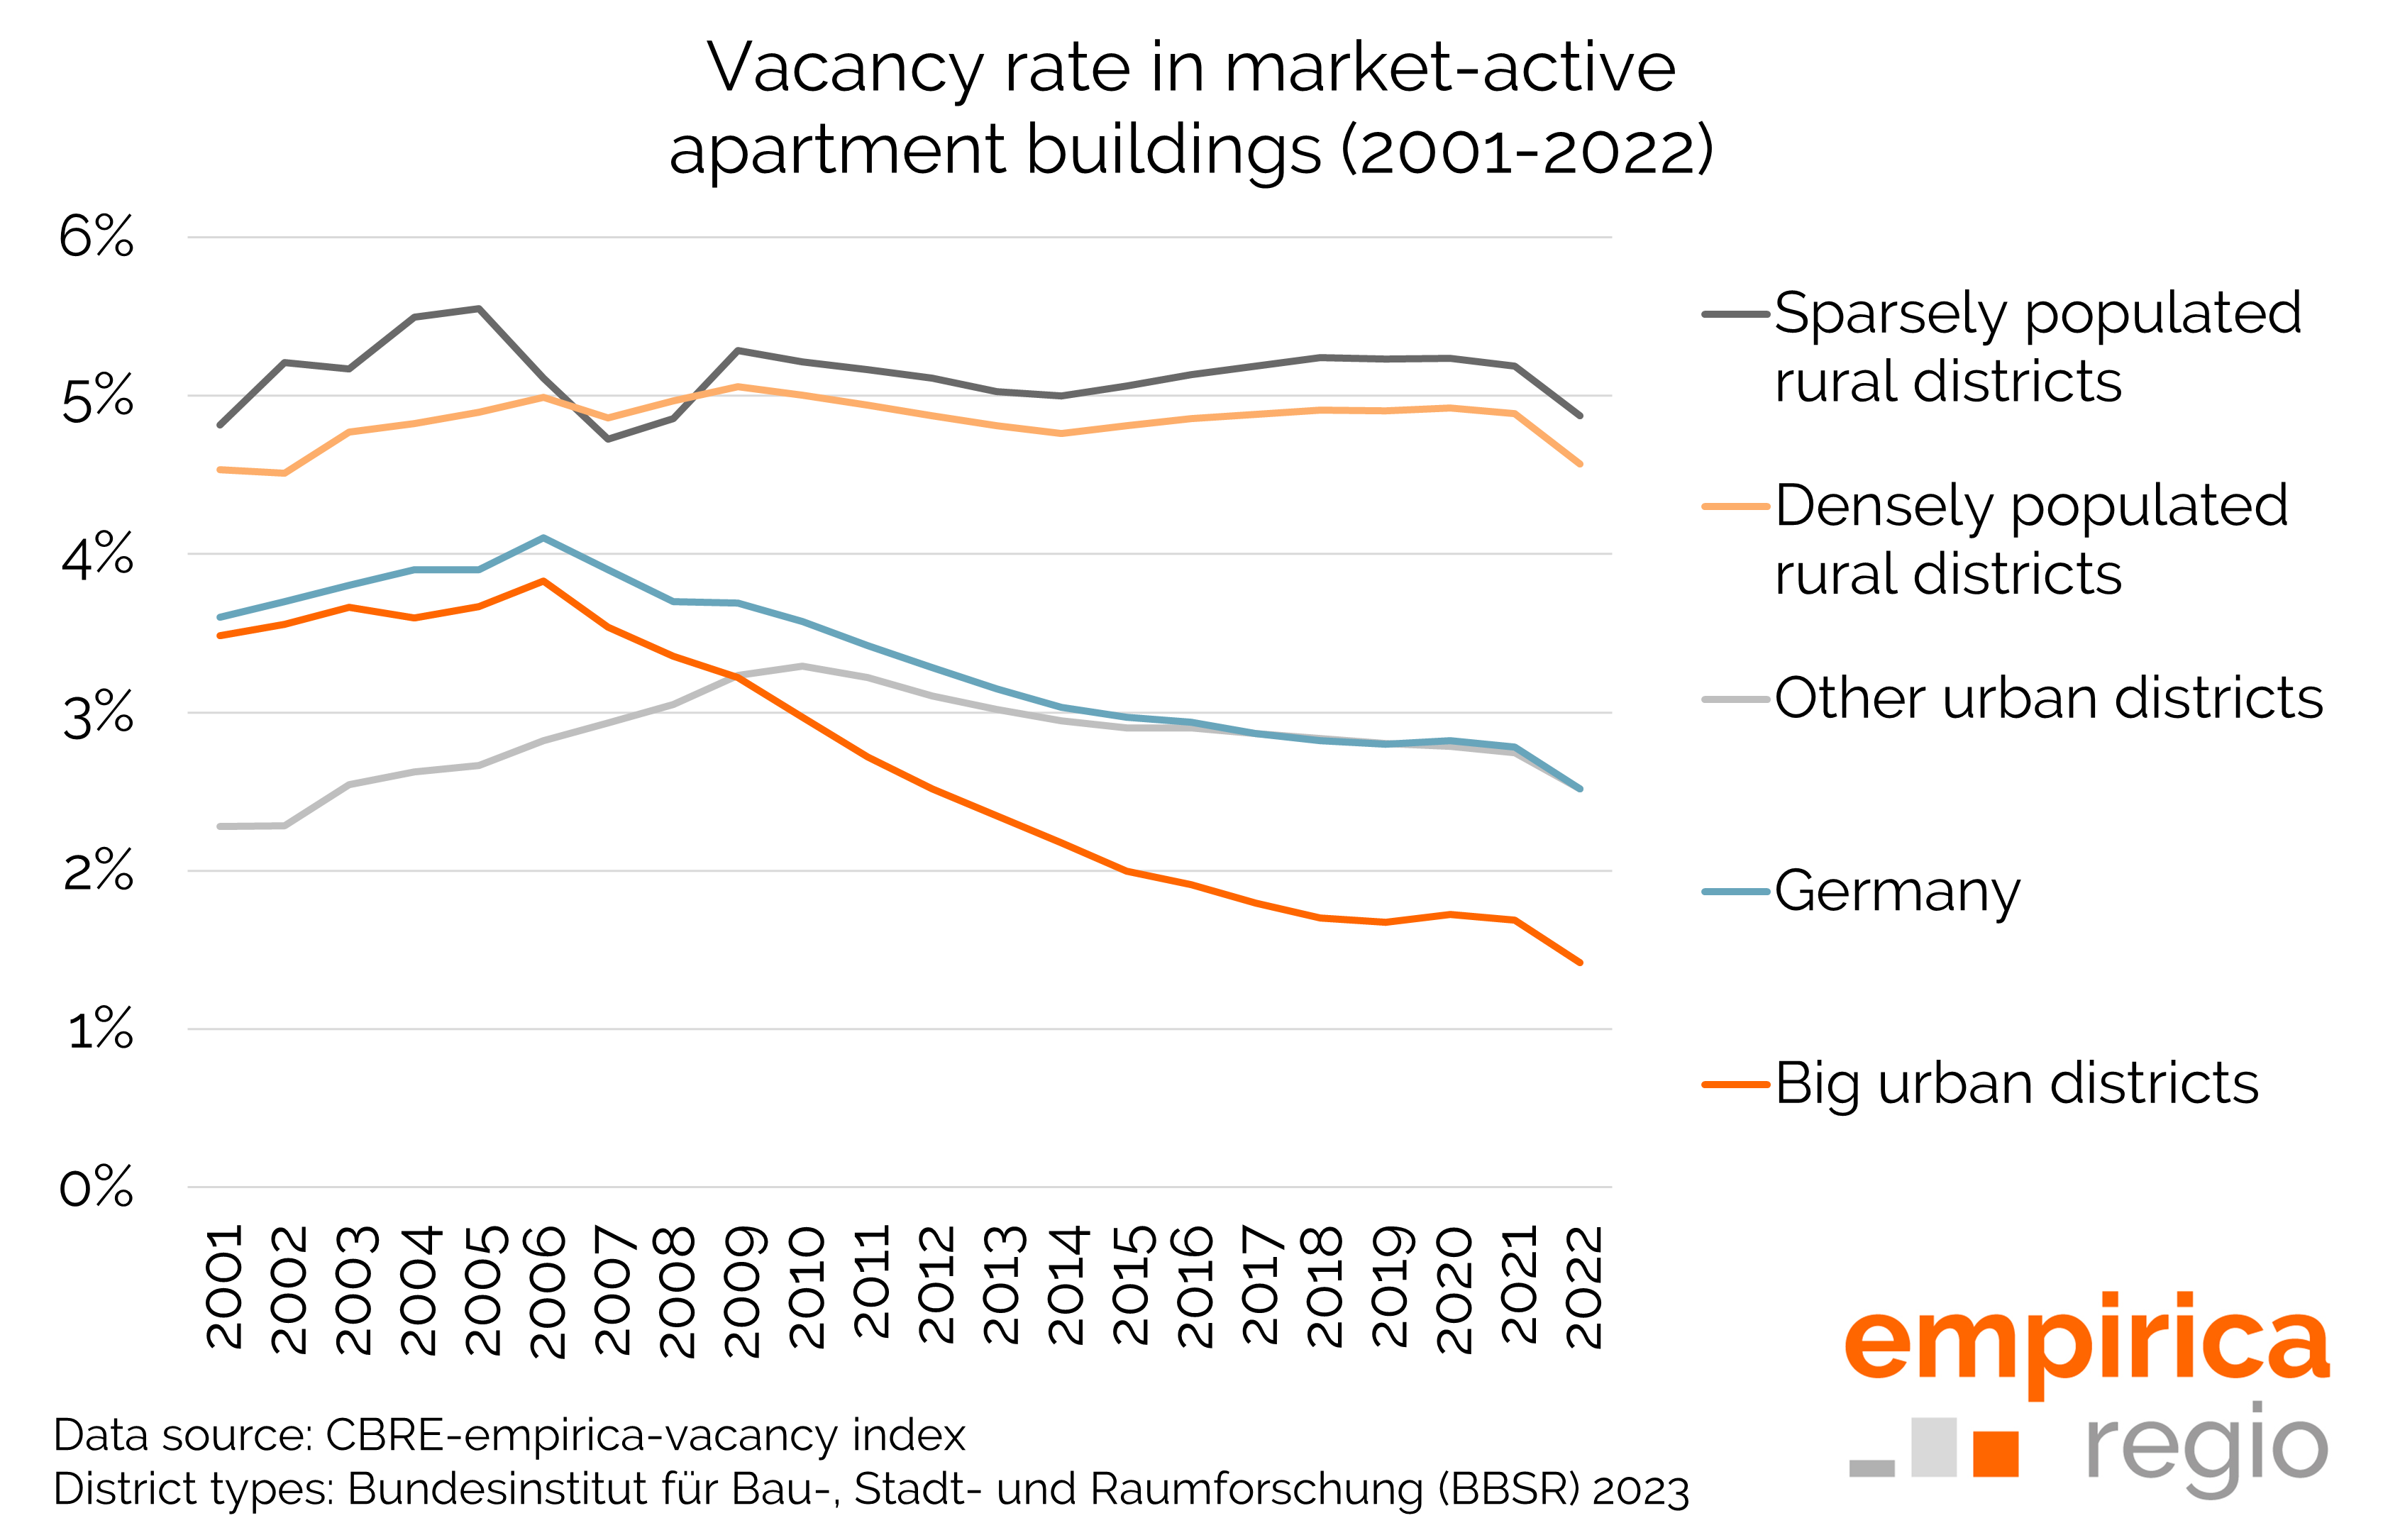
The market-active vacancy rate for multi-storey flats – those that are immediately lettable or can be made available in the medium term – stood at 2.2% or around 522,000 units at the end of 2024. This represents a decrease of approximately 45,000 units compared with the previous year, 2023 (around 567,000 units). Whereas last year vacancy rates had fallen year-on-year in 174 of the 400 districts and independent cities (44%), this is now the case in 338 districts (85%).

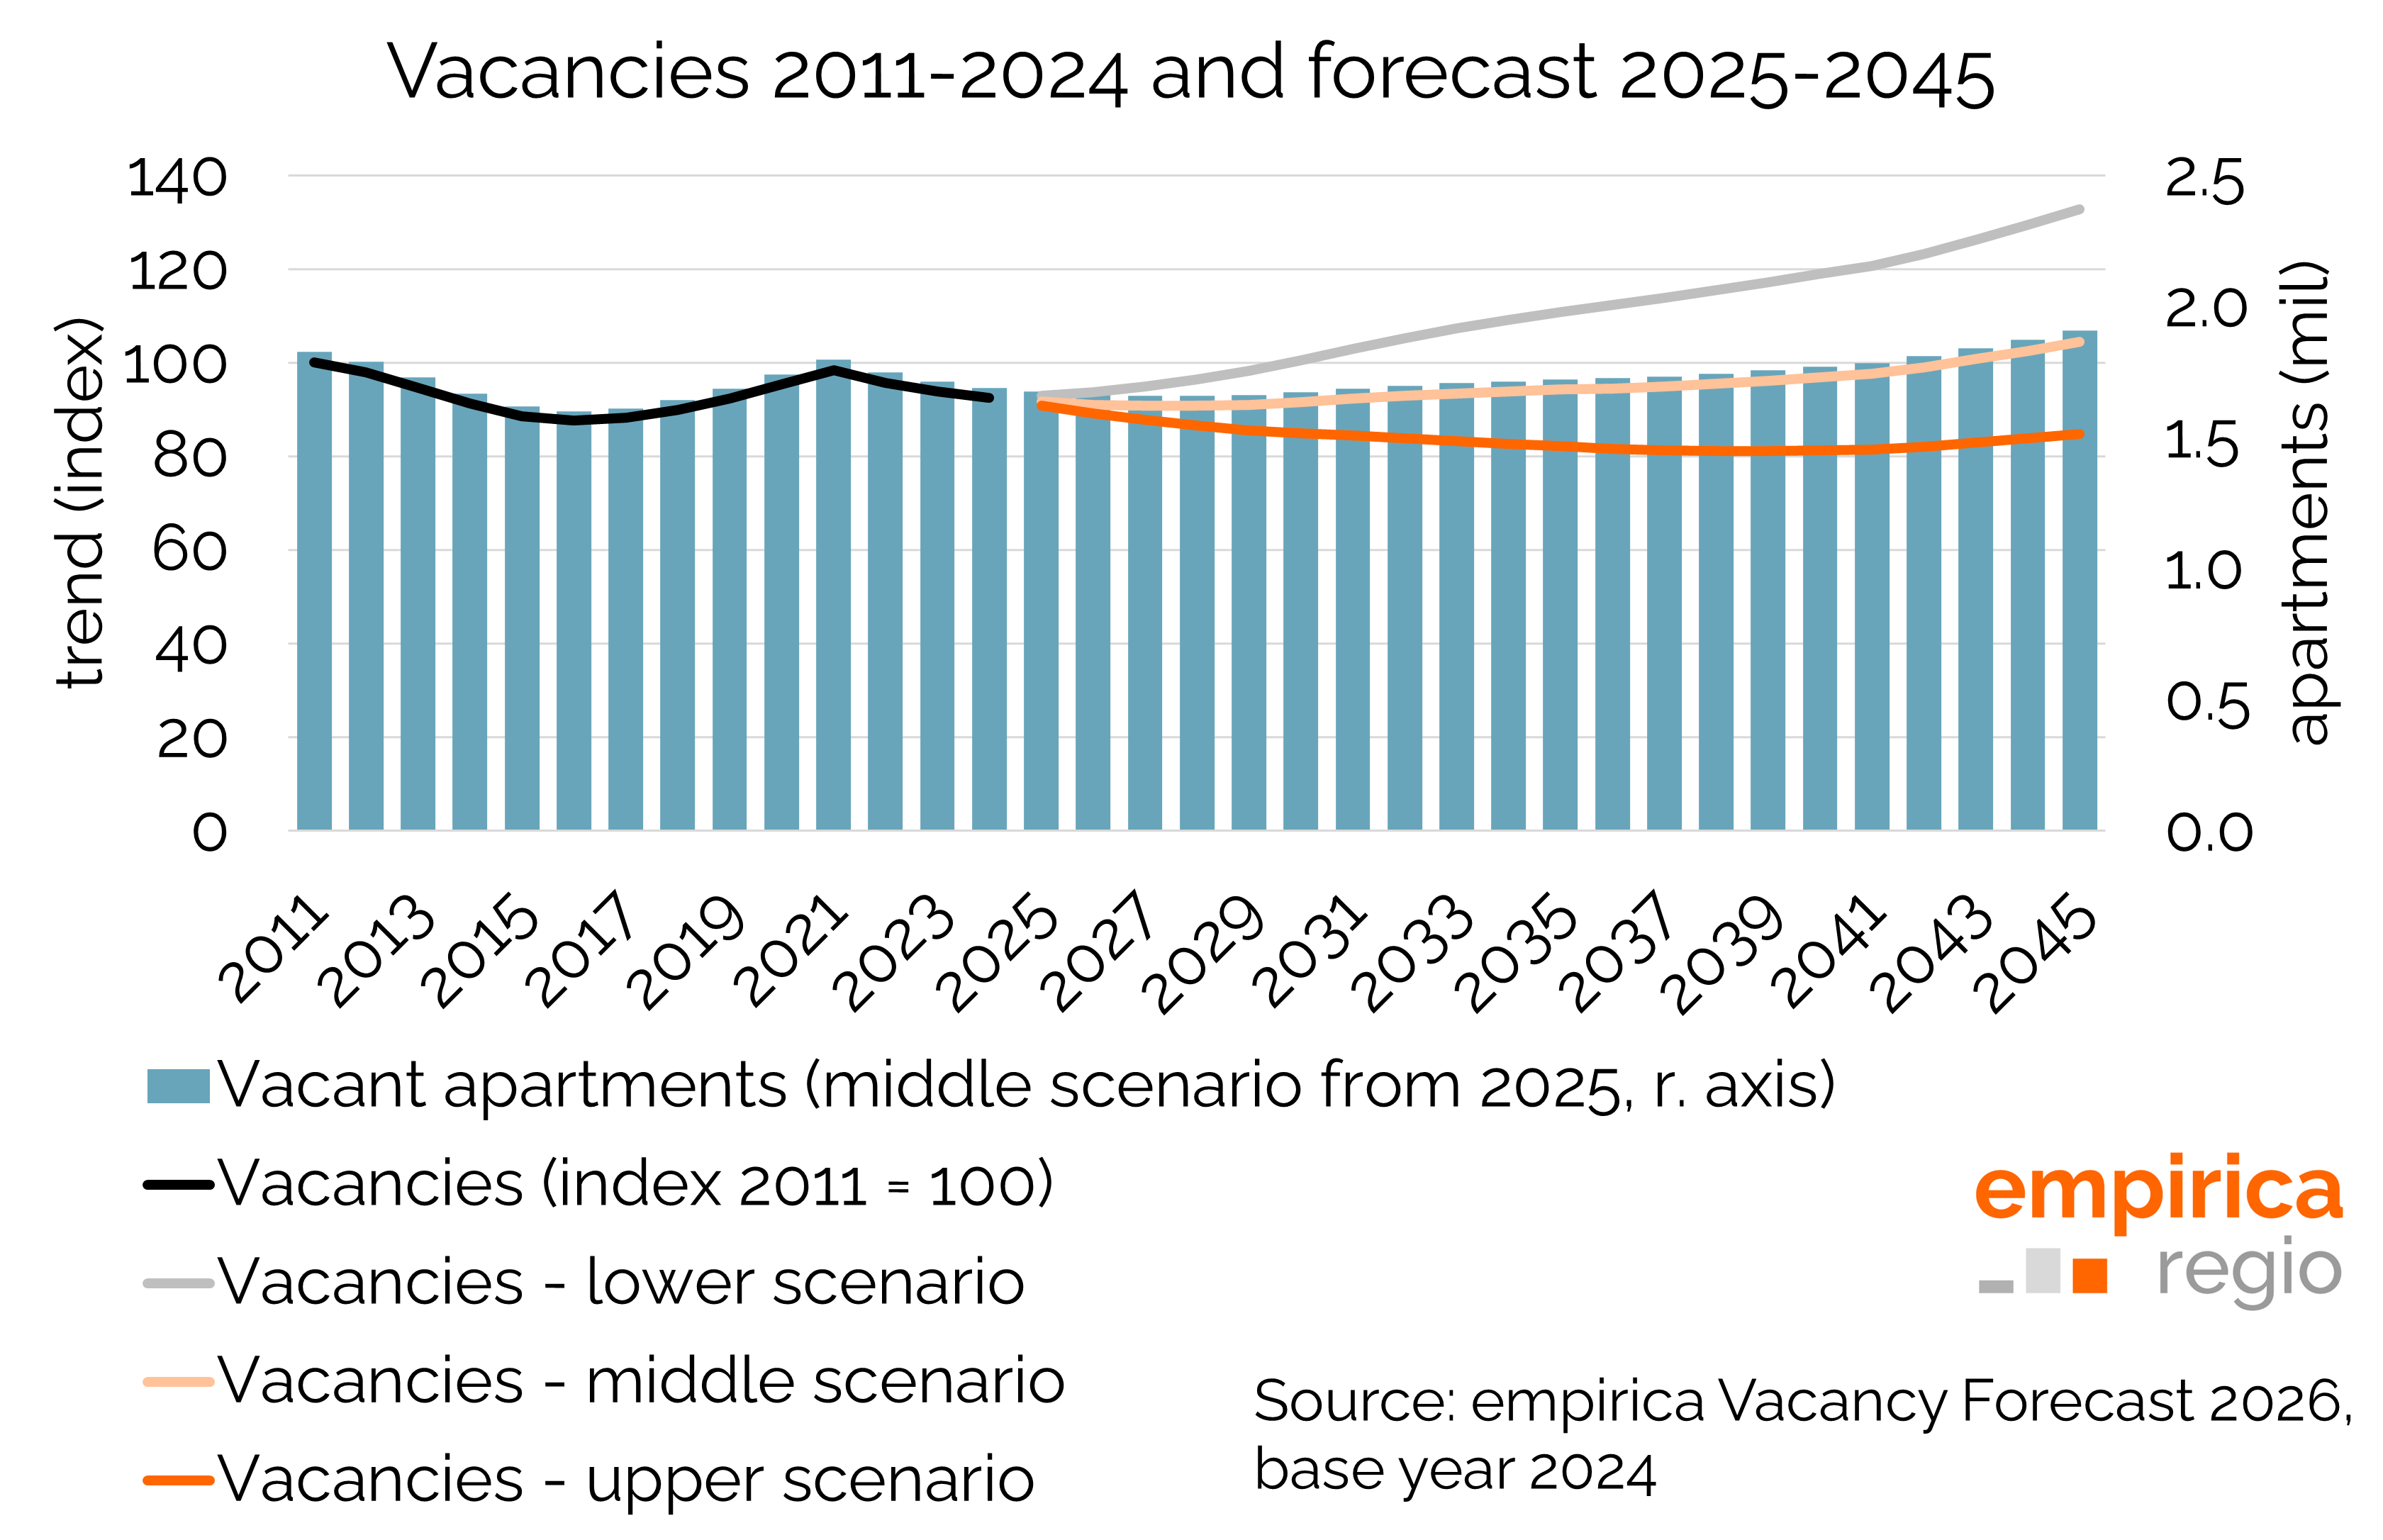
Of a total of 1.7 million vacant dwellings in 2024, 963,000 were in apartment building stock and a further 727,000 in single-family and two-family houses. Compared to 2023, vacancy rates fell slightly nationwide; the vacancy forecast indicates a further, slight decline in vacancies of around 31,000 flats by 2028, assuming moderate immigration in the medium scenario, followed by an increase that accelerates again in the 2040s. By 2045, there would then be around 217,000 more vacant flats than in 2024, and the total number of vacant flats would amount to around 1.9 million.
Subscription options for the CBRE-empirica Vacancy Index, total vacancy rate and vacancy forecast
Are you interested in the CBRE-empirica Vacancy Index, the time series on total vacancy rates, or the vacancy forecast? You can obtain the data at district level from empirica regio by accessing the empirica Regional Database (Market Studio and RESTful API ). In addition to access to the vacancy index, you benefit from a wide range of other data. You also get immediate access to the updated index as soon as it is published.
If you are interested in a consultation appointment or an individual offer for acquiring vacancy data, please contact us by e-mail at info@empirica-regio.de or under +49 (0) 30 884 795 55.
Data source and methodology
The calculation of total vacancies is based on the 2011 and 2022 censuses. As the 2022 census was conducted in the spring and therefore could not yet capture the majority of immigration from Ukraine, the 2022 census vacancy figures are interpreted as year-end figures for 2021. The figures between 2011 and 2022 are interpolated, whilst those from 2022 onwards are extrapolated. A comprehensive estimation model was developed for the interpolation and extrapolation, based, amongst other things, on regional qualitative and quantitative additional demand as well as regional changes in the housing stock.
The market-active vacancy rate includes vacant dwellings that are immediately available, as well as vacant dwellings that are not currently available for letting due to defects but could potentially be made available in the medium term (within 6 months). The calculation of market-active vacancies in single-family and two-family houses is based on the 2022 census and is carried out using a methodology comparable to that used for calculating total vacancies. The basis for market-active vacancies in the apartment building stock is provided by management data from CBRE (several hundred thousand residential units). The calculations incorporate extensive analyses and estimates based on the empirica regional database and the Federal Statistical Office, including data on regional changes in housing stock, households, home ownership rates and rents.
To calculate the vacancy forecast, it is assumed that new-build construction meets the additional quantitative demand, as well as 10% of the additional qualitative demand for apartment buildings and 50% of the additional qualitative demand for single-family dwellings. The remaining additional qualitative demand is either not met through new construction or is met through the demolition and reconstruction or refurbishment of existing vacant properties. Furthermore, an annual housing loss of 0.3% for multi-family dwellings and 0.1% for single-family dwellings is assumed. The vacancy forecast is then derived from the difference between the projected housing stock and the demand forecast from households . In this context, existing vacancies are not filled, but the additional demand is channelled into new dwellings. Furthermore, no distinction is made between demolition and new-build within the existing housing stock or new-build on greenfield sites.
Detailed results and further information on the methodology can be downloaded from the empirica ag website.