Housing vacancies between urban and rural areas

In the housing policy debate around new housing, immigration, shortage of housing and urban sprawl, the issue of vacancy rarely plays a role. The vacancy rate offers important insight into the state of housing shortage in individual regions. However, a generalised view of the data alone does not help in the analysis of vacancy figures. The mutual interactions are far too complex, for example, when it comes to the regionally very different imbalance between supply and demand or migration movements from the A and B cities to more rural areas.
In addition, there are various statistics on vacancy rates, but only a few reflect regional differences. For this, empirica regio can refer to two data sets: The CBRE-empirica vacancy index for the so-called market-active apartment vacancy and the total vacancy recorded in the accounts. These data show the vacancy development at the level of the districts.
Germany-wide vacancy development
First, let’s look at the federal trends: With regard to the total number of vacant flats, the number has increased significantly. While in 2020 there were 1,621,800 vacant dwellings, in 2021 there were 1,721,274 dwellings. These figures are based on the vacancy rate recorded in the accounts. This represents the development of the total vacancy since the vacancy survey of the 2011 Census. The basis is formed by the actual completions and the development of the population, the regional household sizes, the segment-specific (houses, aparments) developments of demand as well as annual housing demolitions. That is why we speak of an accounting vacancy observation.
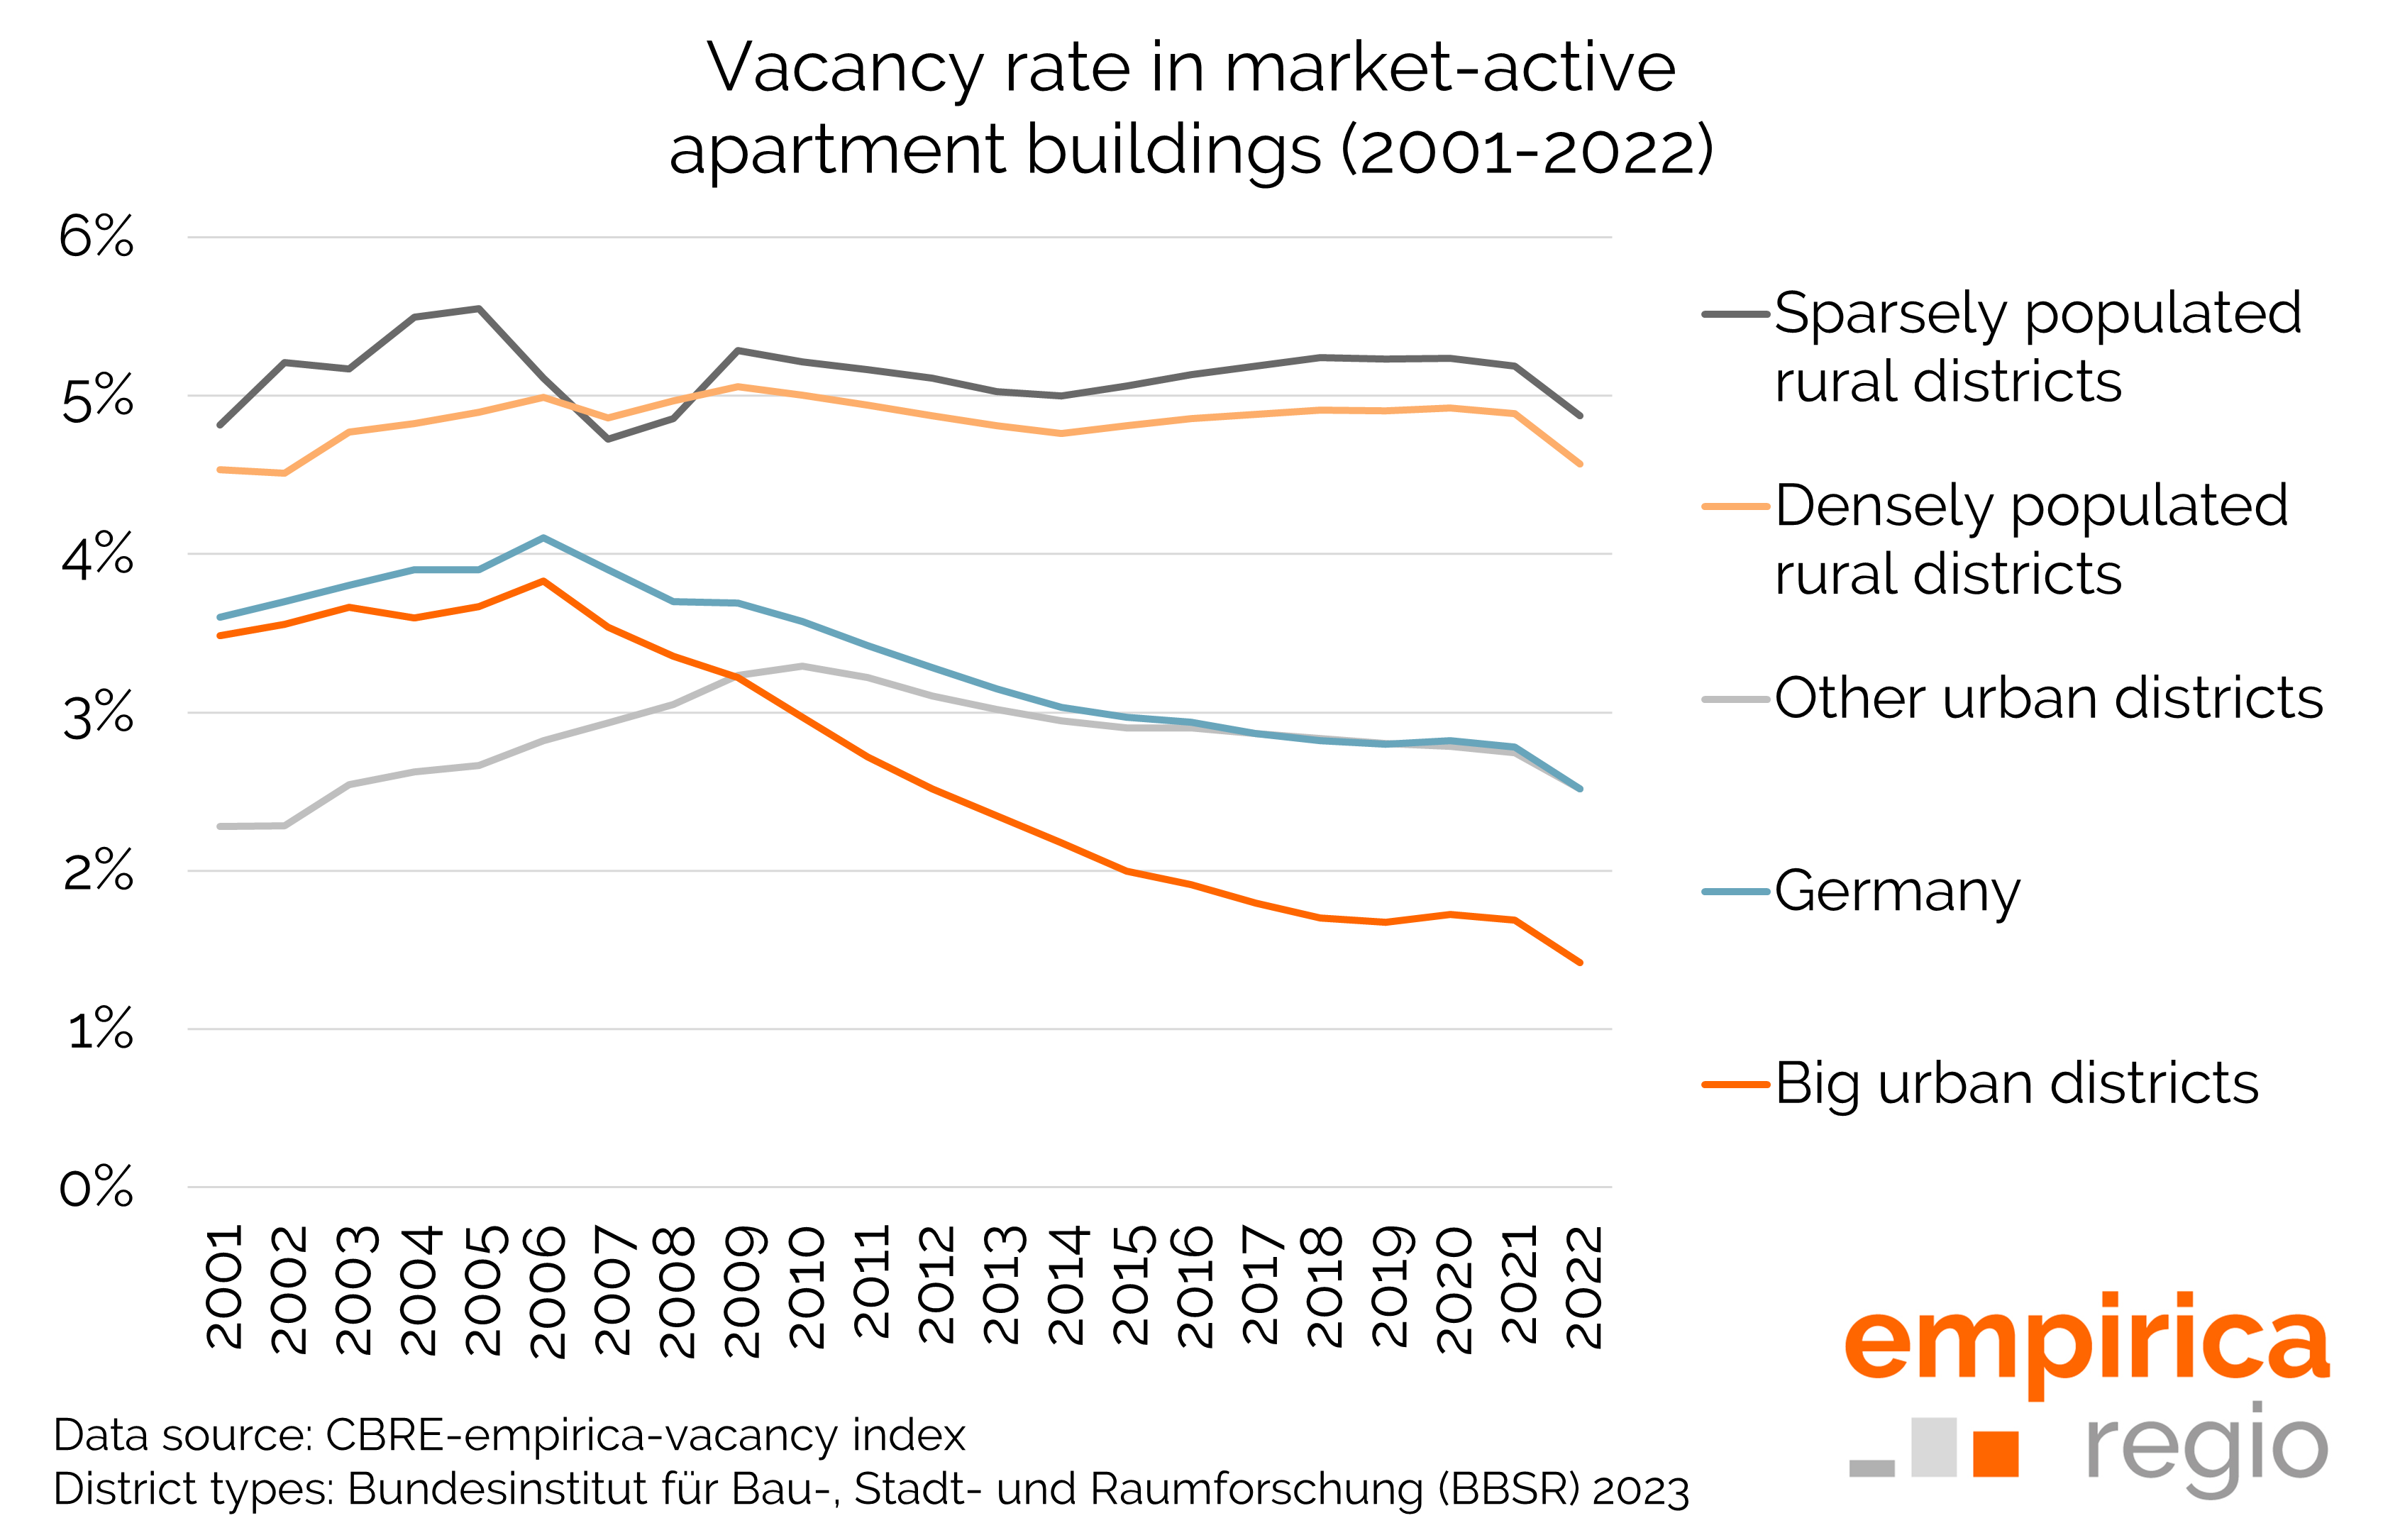
What is striking here is that the number of apartments that no longer fell into the market-active category, i.e. that could not be rented or lived in within six months, rose considerably: from 469,682 in 2021 to 567,701 one year later. In contrast, there was little year-on-year movement in single-family or two-family houses and market-active multi-storey apartments. The market-active vacancy rate is based on management data from the real estate consultancy CBRE (around 920,000 residential units as of 31 December 2021) and extensive analyses and estimates based on the empirica regional database.
Overall, this consolidates an important trend of the past years. While the absolute vacancy rate fell by half a million flats between the census year 2011 and 2015, it has been rising again year after year since then.
Differences between urban and rural areas
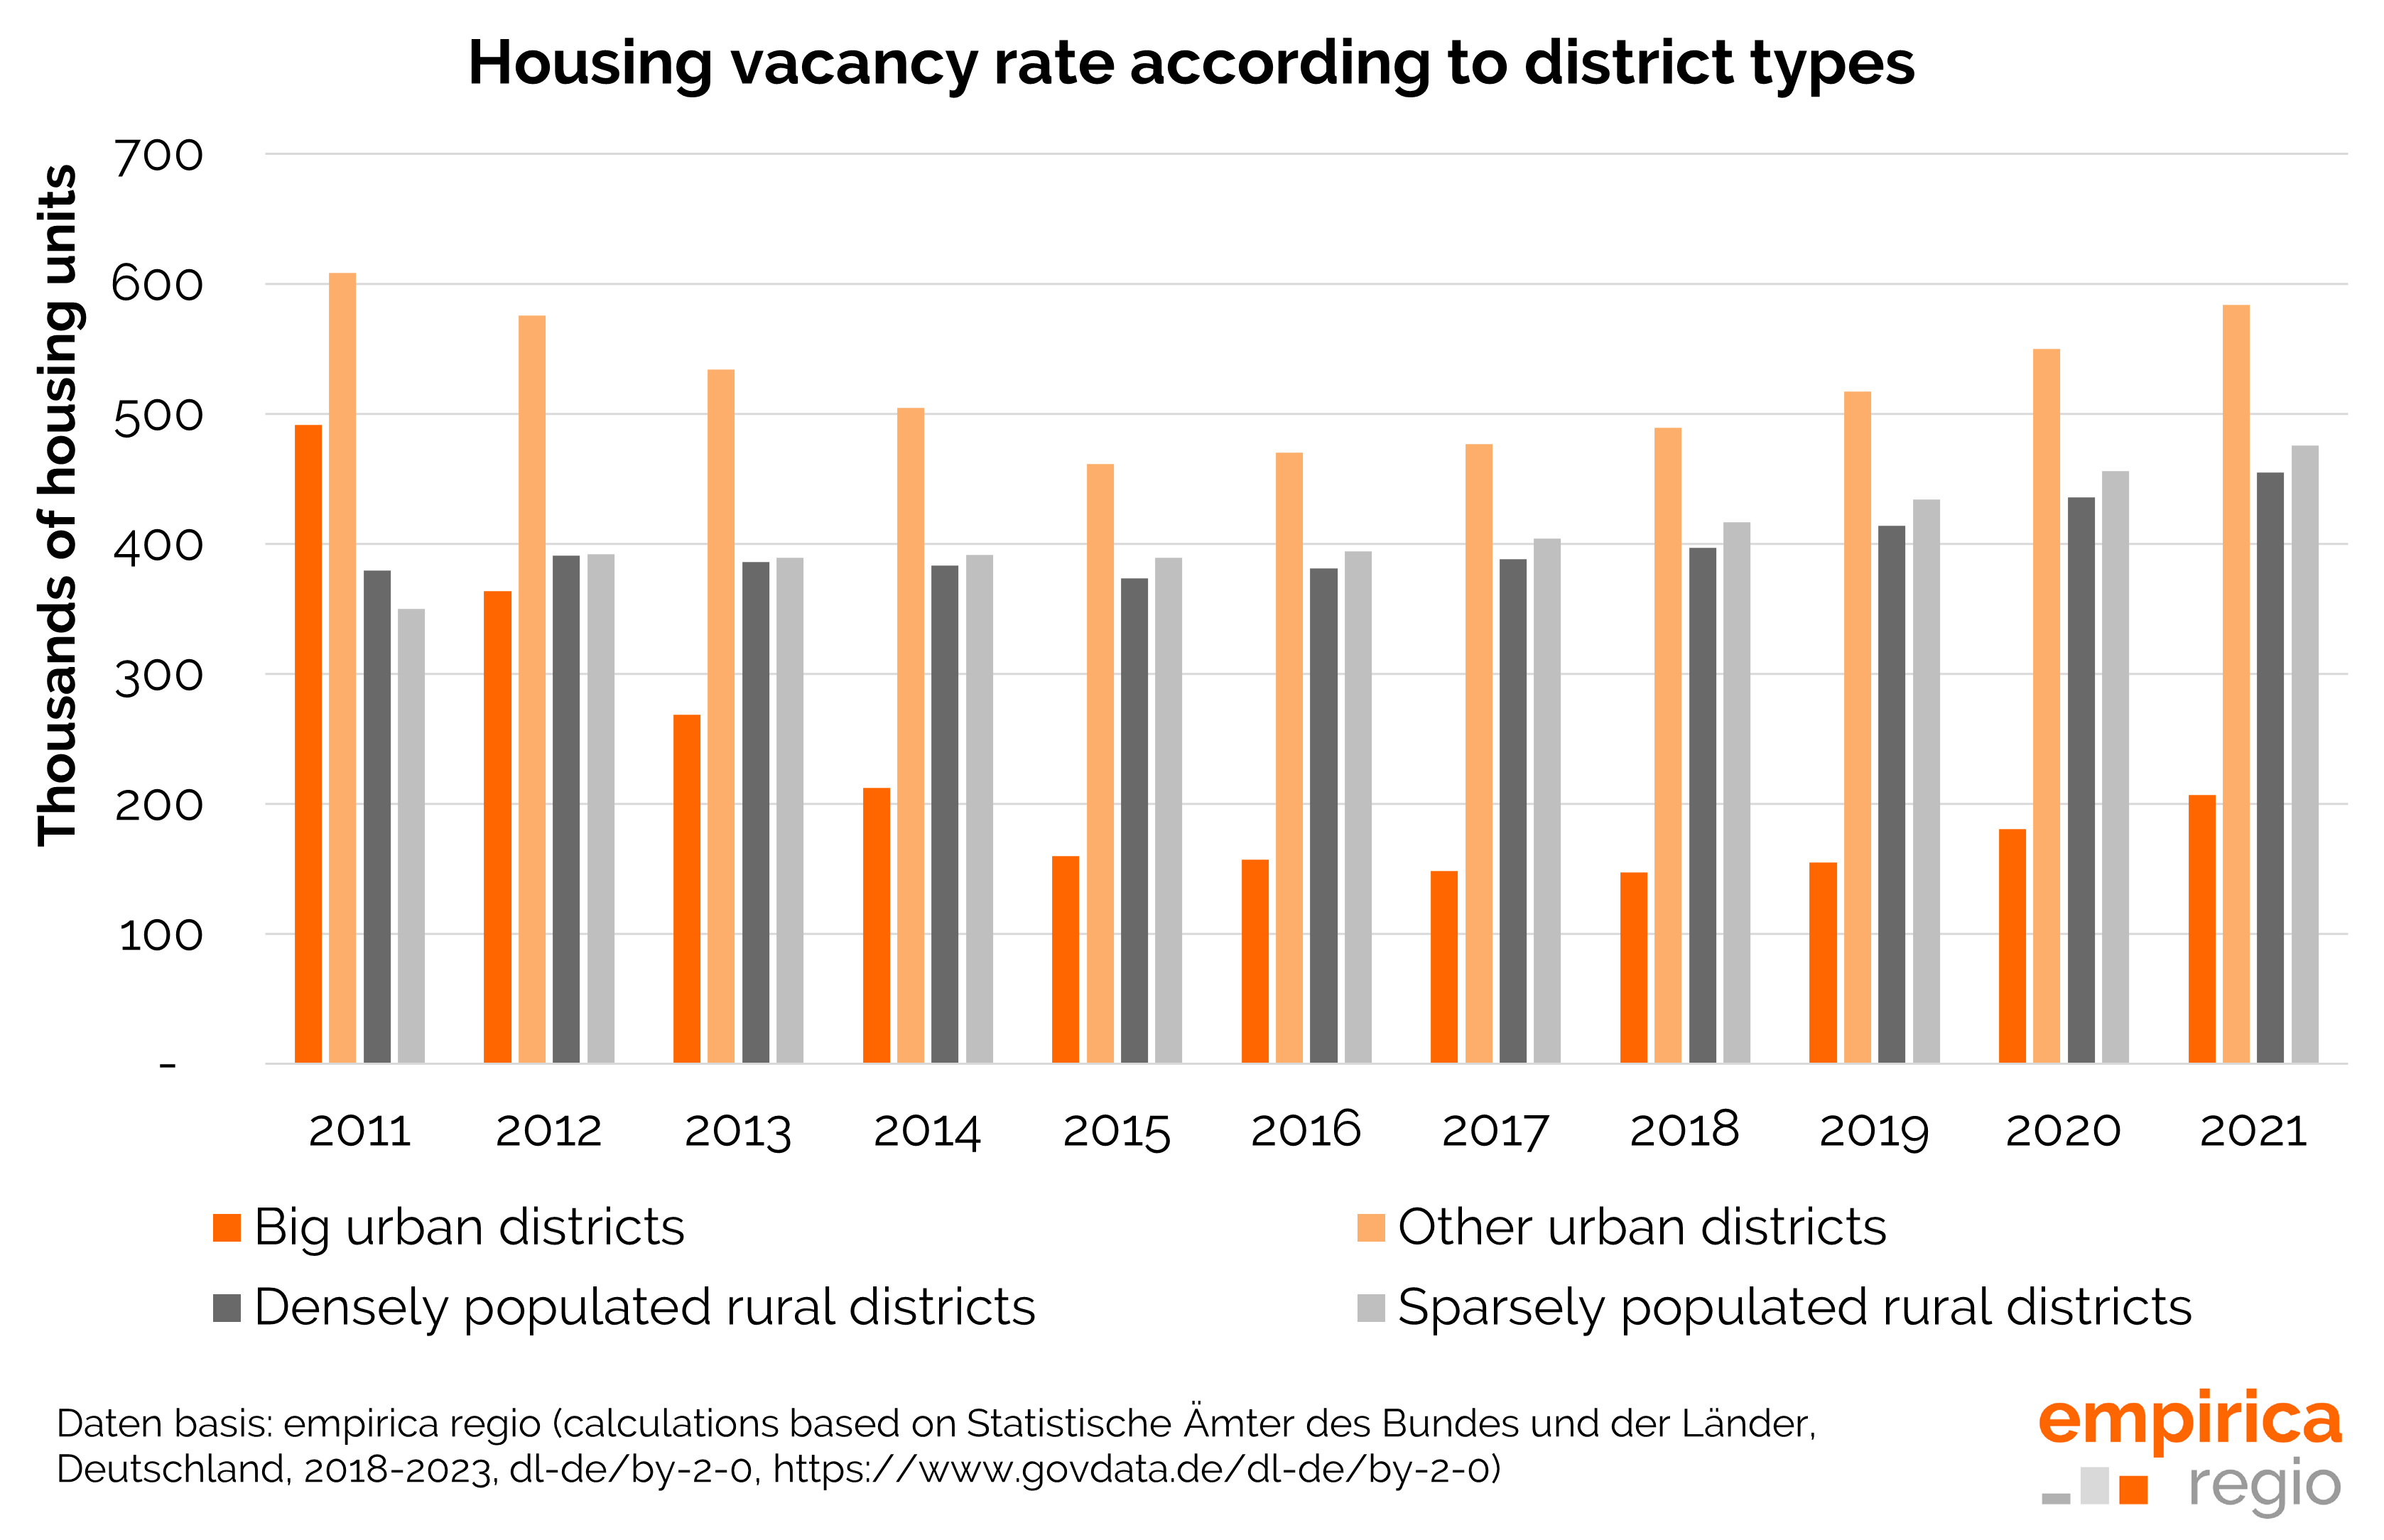
In which types of settlement structure has the vacancy rate increased? In our survey we differentiate between big cities, urban districts, rural districts with densification and sparsely populated rural districts. According to our figures, there is no discernible trend here; the vacancy rate has increased across all types of districts. In the urban districts, for example, it rose from 180,286 in 2020 to 206,056 a year later. In urban counties, vacancy increased from 549,771 to 583,734; in rural counties with densification approaches, the number of vacant properties increased from 435,752 to 454,770; and in sparsely populated rural counties, there was an increase from 455,991 to 473,813 from 2020 to 2021. Thus, an urban-rural differentiation by population density does not provide clear results.
If, on the contrary, one differentiates between the categories of shrinking regions, stagnating regions and growing regions, the increase in vacant properties in the growth regions is particularly striking. From 2020 to 2021, their number rose from 560,416 to 619,088, and this despite the fact that the population in these regions tended to increase. The increase was somewhat less pronounced in the other regions mentioned. In the stagnation regions, the vacancy rate rose from 580,518 to 611,773. In the shrinking regions there were hardly any significant movements. And a look at the map of Germany shows that it is not only regions in eastern Germany that are affected by high vacancy rates.
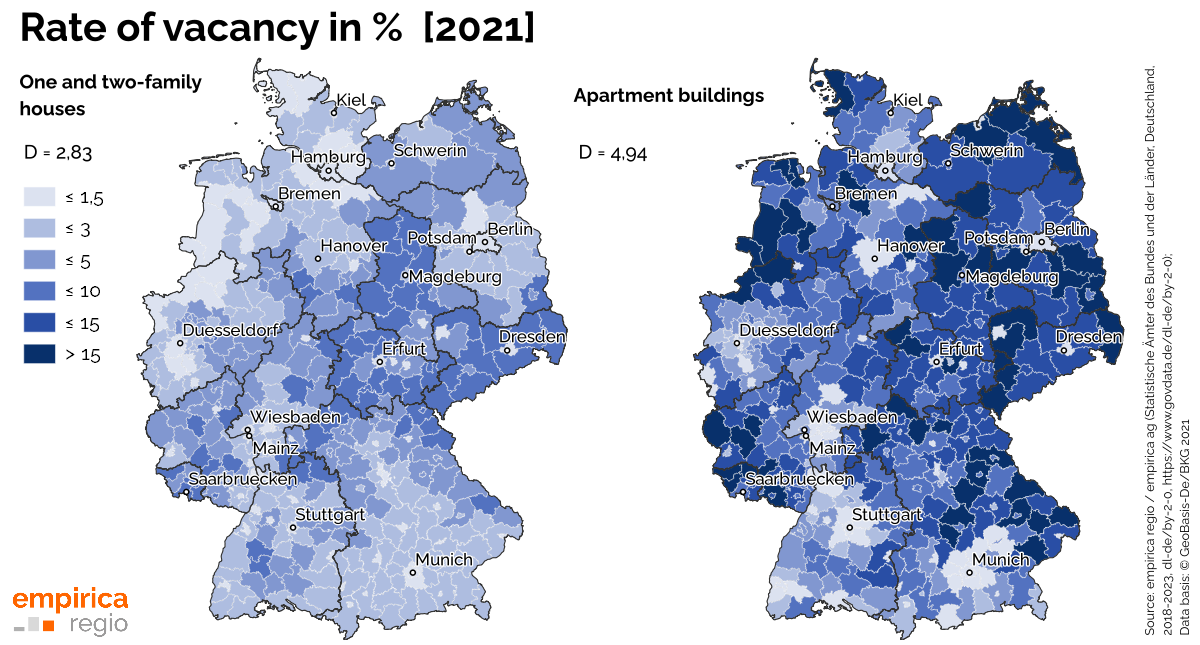
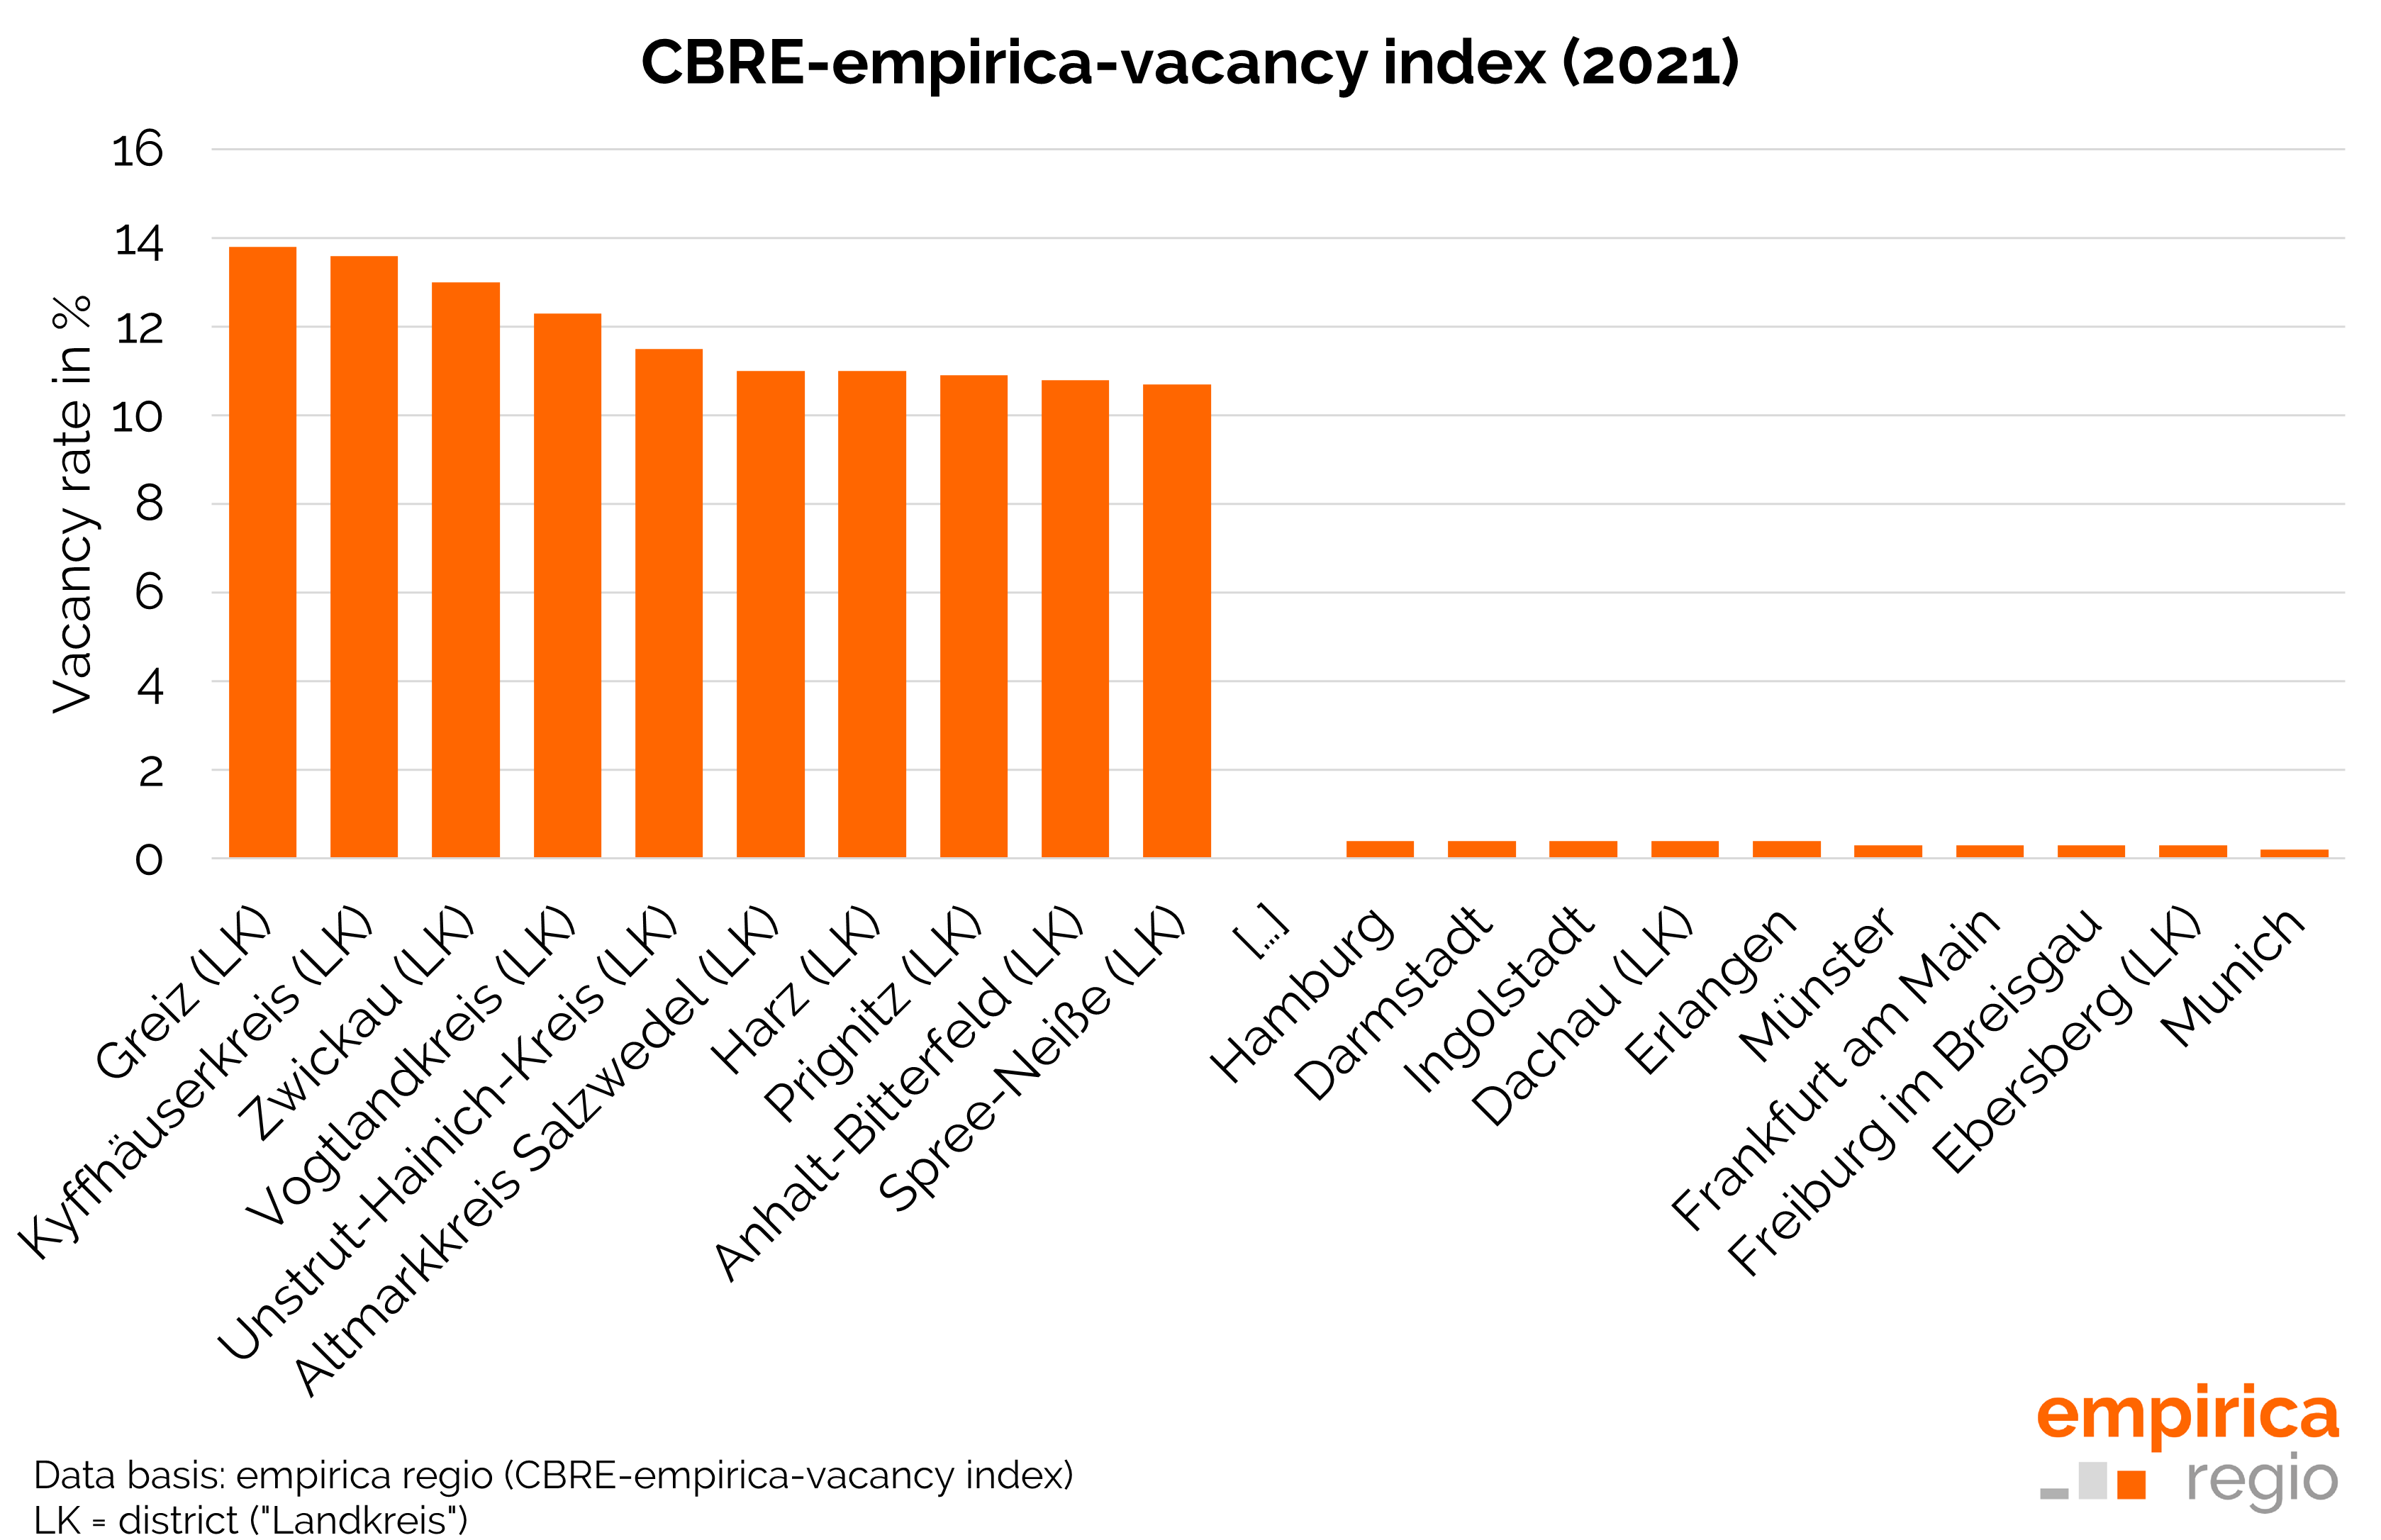
If one takes the vacancy rate of the market-active vacancy from the CBRE-empirica vacancy index, there is a considerable difference with regard to the vacancy in the individual regions. In the so-called A-cities, the vacancy rate in 2021 was 0.7, which has basically hardly moved since 2017. In the B-cities, the vacancy rate was already 2, in the other regions it averaged 3.5. However, there are conspicuous features in particular in individual regions, whereby the federal state of Thuringia seems to be particularly affected. Accordingly, there are particularly high vacancy rates in Greiz in Thuringia as well as in the neighbouring Vogtlandkreis and Kyffhäuserkreis. There, the vacancy rates were far above 10 Prozent.
Conclusion
And what do these figures now mean for the question of whether the “hidden reserve” can be a solution to the shortage on the housing market? The data show that although vacancies are found in many regions in Germany, in terms of quantity they are mainly concentrated in more rural jott-wee-dee regions. This is because flats are generally vacant where they are not needed. A high proportion of this vacancy is also part of the structural vacancy, i.e. it cannot be occupied in the short term and requires investment. And where housing demand is particularly high, the vacancy reserves are exhausted. So the answer is either households must increasingly move not only to the outskirts of the cities but properly to the federal state, or new housing must be built as a priority where demand is high. The former is only an alternative for a few households, the latter will not bring any relief in the near future in view of the current situation in new construction.
Daten sources
Braun, Reiner; Schwede, Philipp; Rachowka, Arthur (2020): Künftige Wohnungsleerstände in Deutschland. Regionale Besonderheiten und Auswirkungen. Hg. v. Bundesinstitut für Bau-, Stadt- und Raumforschung (BBSR) im Bundesamt für Bauwesen und Raumordnung (BBR).
Download (extern)
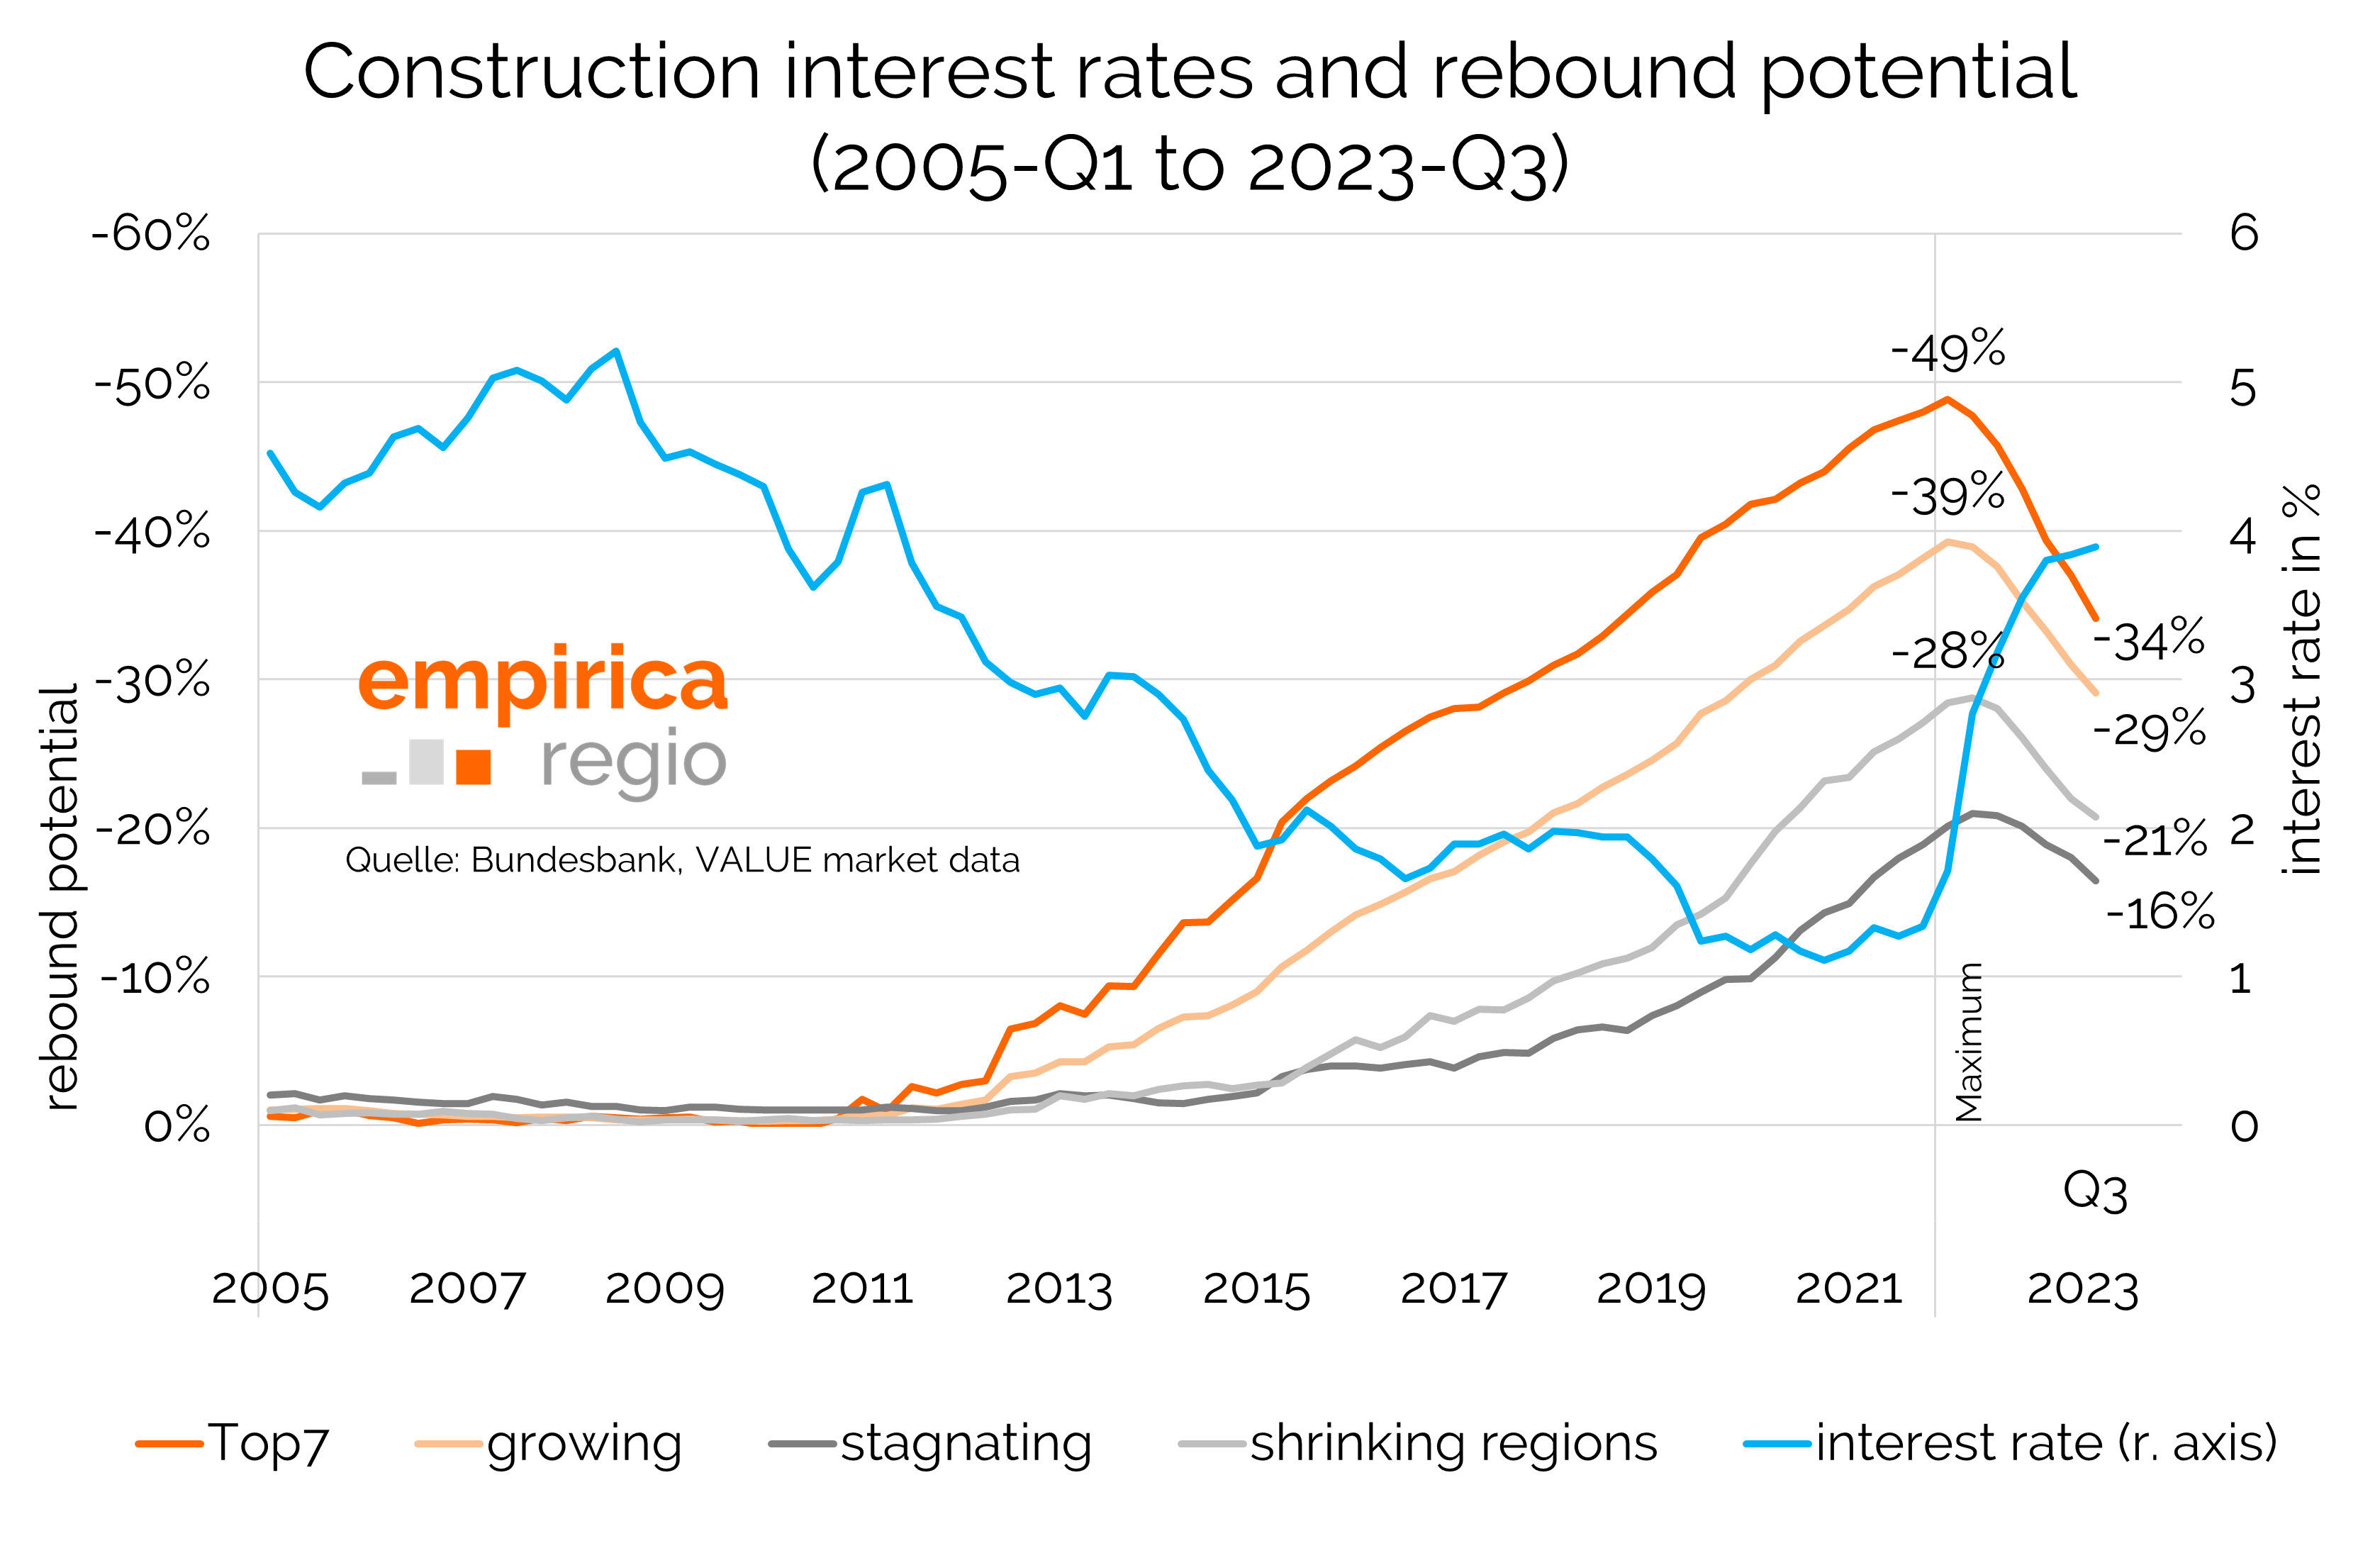
The differentiation of the districts according to population development is calculated by empirica regio and is based on the population dynamics of the last five years (here 2016-2021). Districts with a population loss of more than 1% are designated as shrinking regions. If there is a population gain of more than 1%, a district is designated as a growth region. Districts in between represent stagnation regions.