empirica Forecasts
The empirica forecasts show the regional demographic trends and their impact on the housing market up to 2045. Three scenarios take into account different migration scenarios for international migration. Along these development paths, the forecasts illustrate which demand trends can be expected in the different housing market regions in Germany. The forecasts are updated once a year to take account of new trends, particularly in foreign migration.
Population and Household Forecast
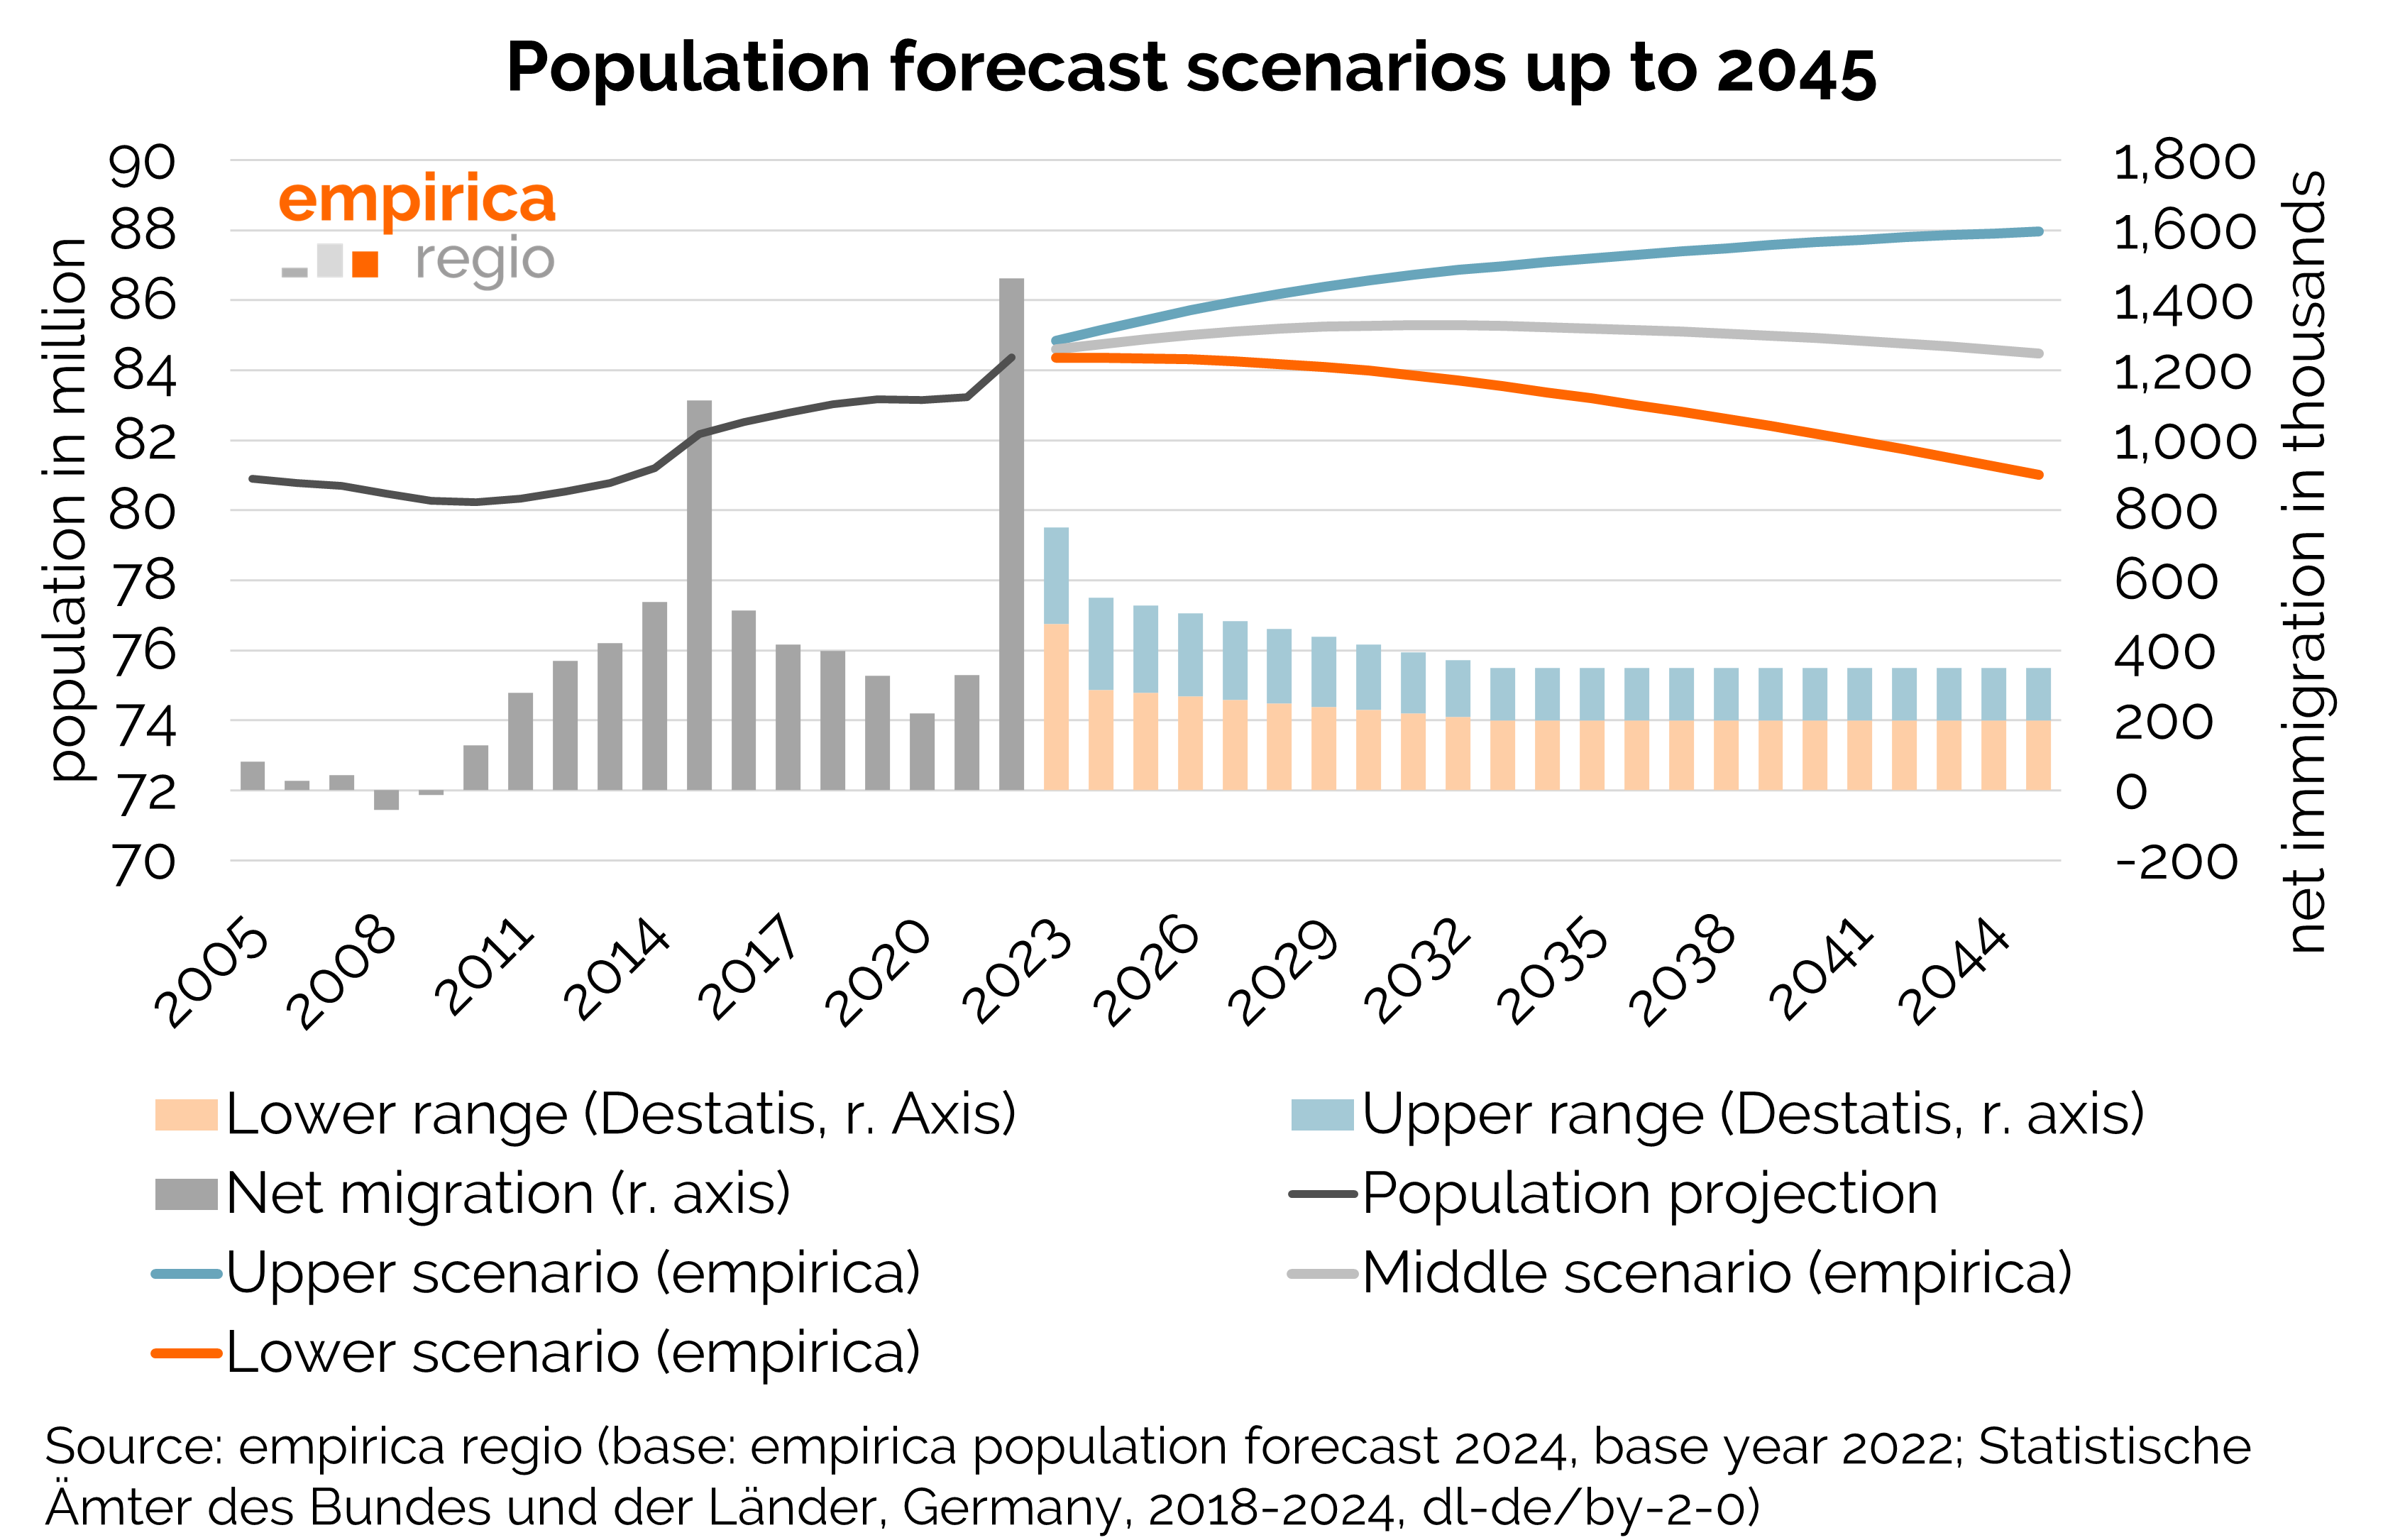
The population forecast distinguishes between three scenarios (upper, middle and lower variants) and shows population development up to 2045 at district and municipal level. All three scenarios assume increased immigration at the beginning of the forecast period and a decline in immigration figures to a constant level from 2033 onwards. In the current forecast, the number of inhabitants will change from around 83.6 million in 2024 to 80.3 million in the lower variant and 86.3 million in the upper variant in 2045. As both internal migration and international migration are concentrated in certain regions, the east-west and north-south divide will continue to widen. Even in the upper scenario, many regions will shrink in the long term, but in the lower scenario this will already happen in the short term.
Housing Market Forecast
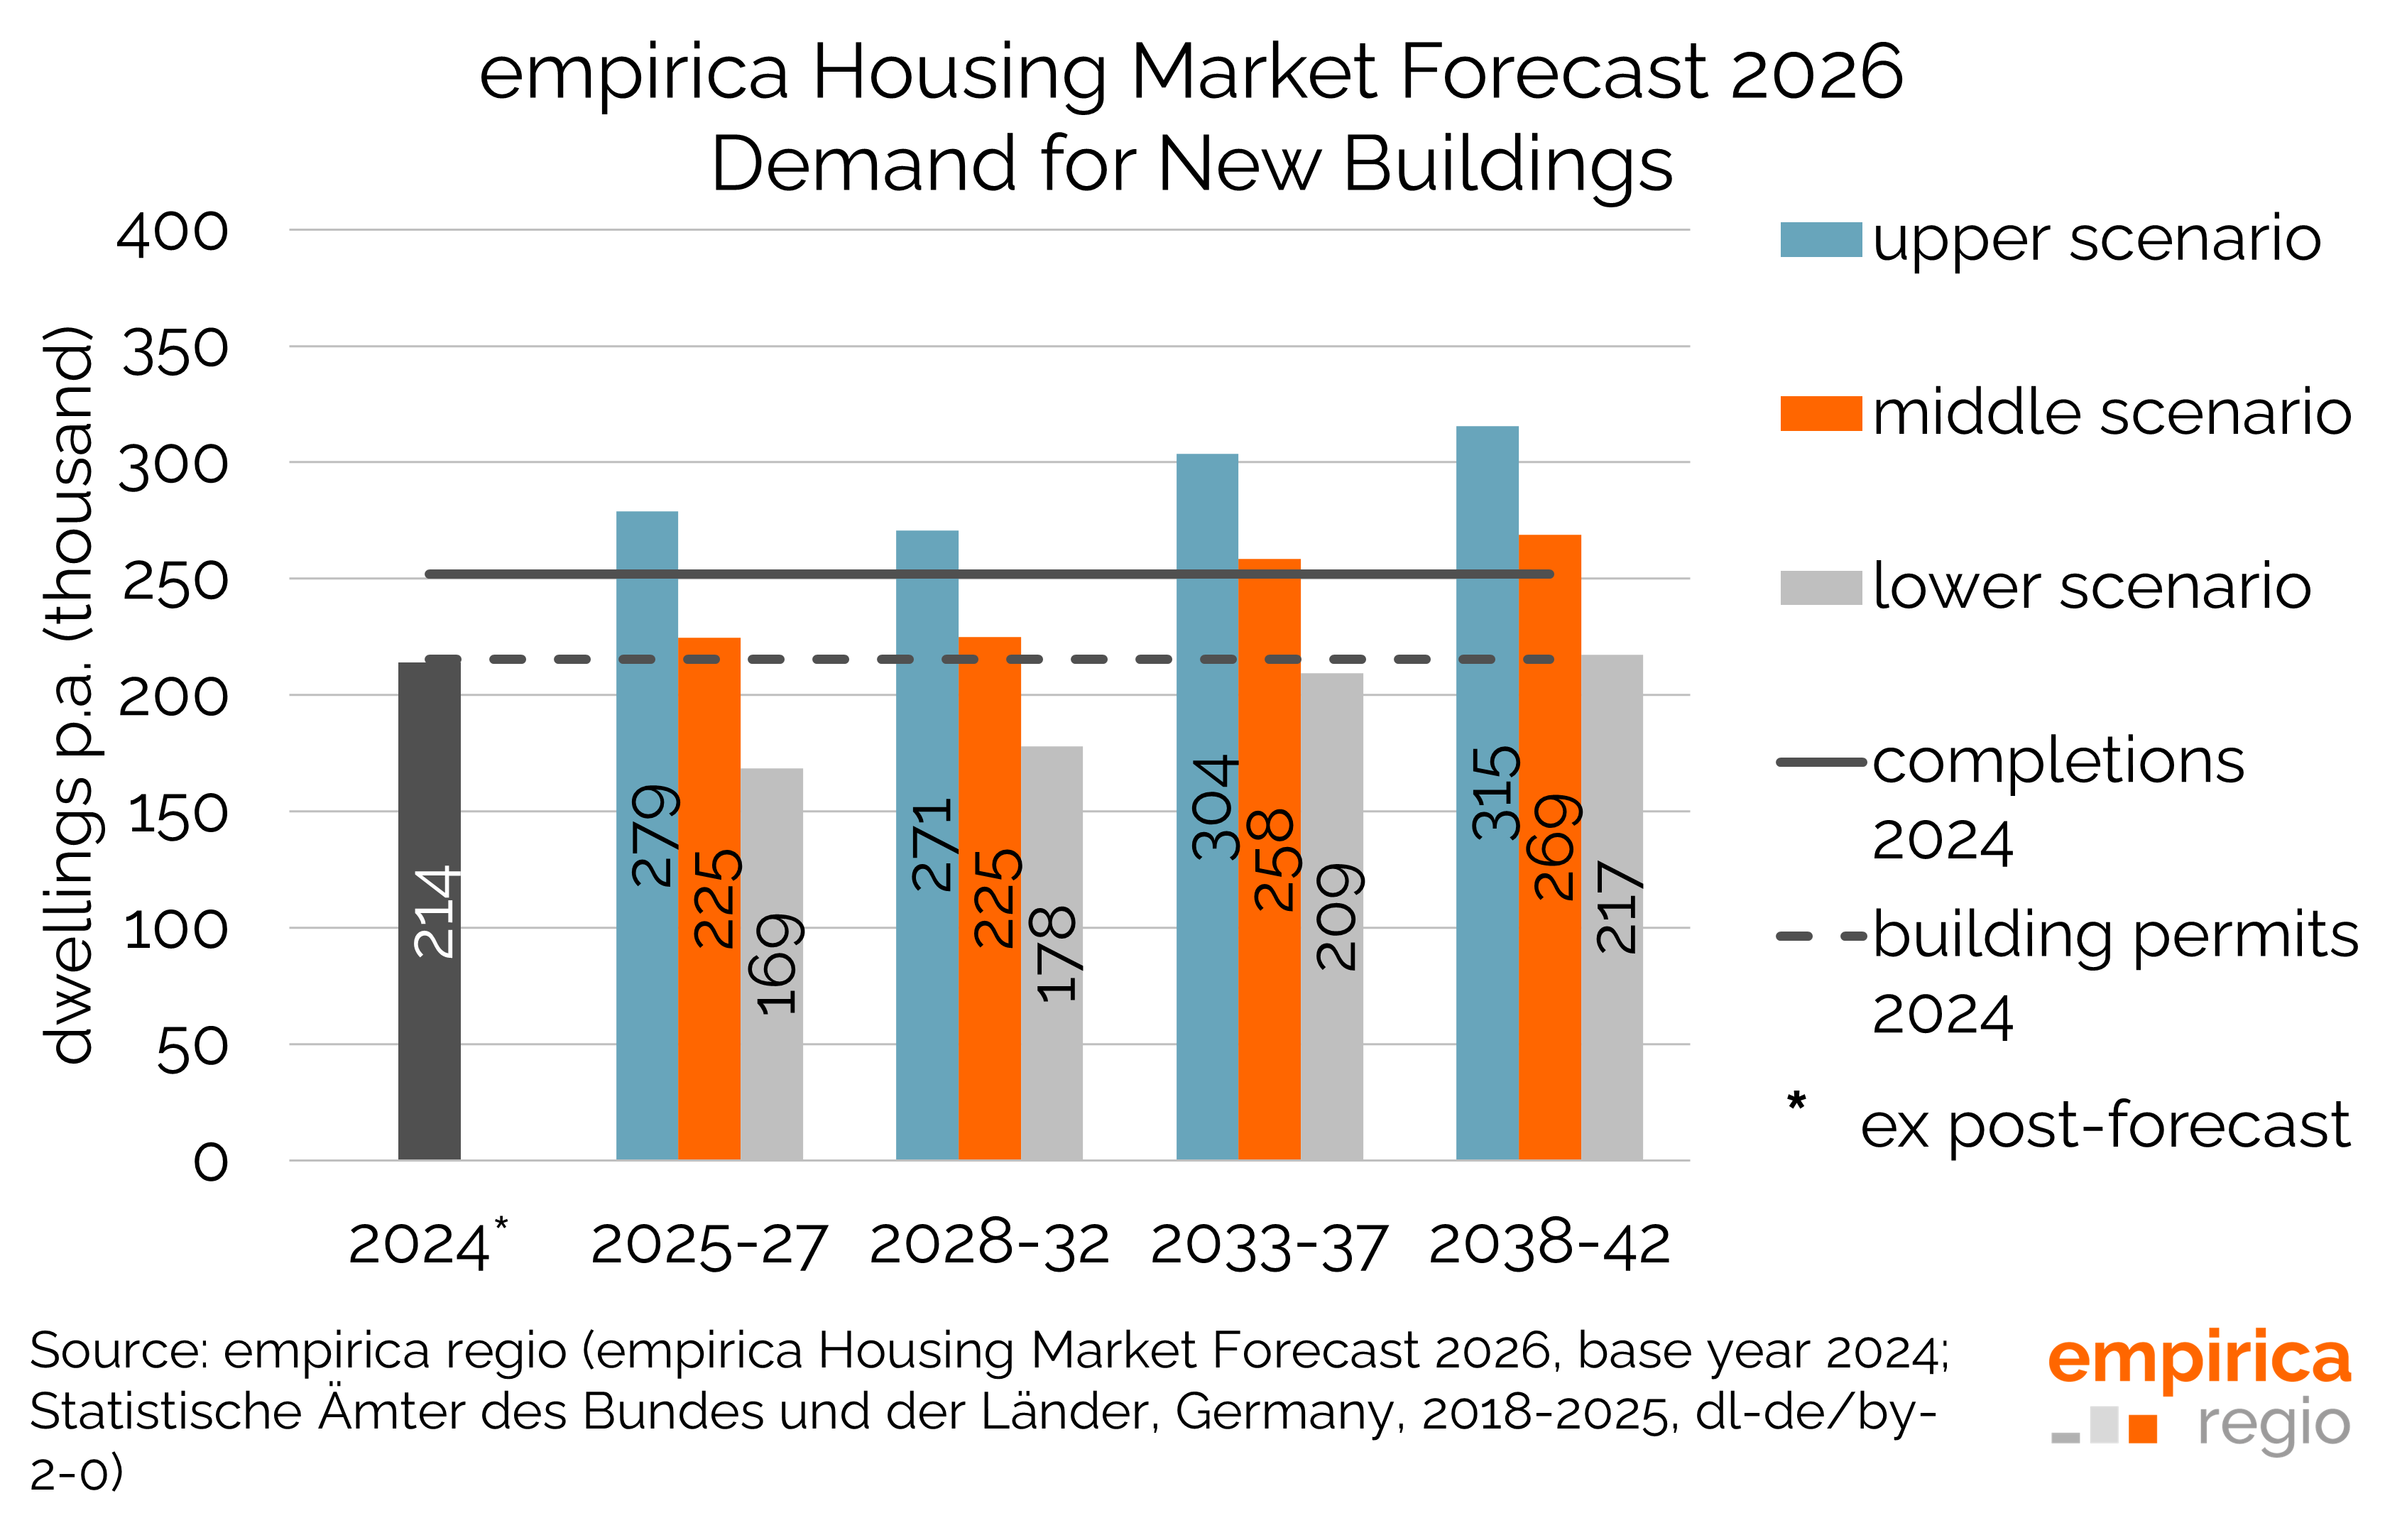
Empirica’s demand forecast shows an annual demand for new construction of around 225,000 flats for the period 2025-32. From the mid-2030s onwards, demand will rise to around 258,000 to 269,000 units per year. Even with a nationwide decline in population, demand for new construction will rise slightly again in the 2030s. This is due to growing additional demand for quality (e.g. hardly any new age-appropriate housing), but also to regional differences in population and household development and changes in the demographic structure. Demand will then rise more strongly than in previous years, especially in growing regions. In addition, the number of older people is expected to increase in the long term, which will lead to a higher number of households given the current population.
Detailed results and further information on the methodology can be found in empirica paper no. 281, which is available for download on the empirica ag website:
External download (available in German only): empirica-Paper Nr. 281
Purchase Options
Are you interested in data from the empirica housing market forecast 2026? You can obtain the results of our forecast models and many other data bases from empirica regio as access to the empirica regional database (Market Studio and RESTful API ) or as an individual single order.
If you are interested in a consultation appointment or an individual offer to obtain the forecasts, please contact us by e-mail at info@empirica-regio.de or under ++49 (0) 30 884 795 55.
Methodology
The regionalised population forecast is based on the district forecasts of the federal states and calibrates these to a uniform base year. The empirica population forecast is therefore not a separately calculated forecast, but a results-oriented consolidation of existing state forecasts. In our view, the latter show regional developments with a higher degree of plausibility than other nationwide district forecasts. The household forecast is in turn based on the population forecast. This calculates the future number of households using age-specific household reference person rates, which differentiate between different regional types as well as households with one or two persons and households with three or more persons.
After deducting subtenant households and adding the demand for second homes, the number of households demanding housing is obtained. The additional demand for housing arises from changes in the population, household size and age distribution of households. The resulting forecast for new construction demand takes two components into account: the quantitative additional demand caused by an increase in households demanding housing, and the qualitative additional demand caused by replacement needs in the housing stock. Qualitative additional demand may also exist in shrinking regions if, despite declining household numbers, there is demand for new construction from households in the housing stock.
In addition, an ex post forecast of new construction demand from 2012 onwards is calculated. This is based on official population statistics and can be compared with actual completion figures. From this, empirica calculates a theoretical backlog of demand from unrealised quantitative additional demand. All data relating to the forecast for demand for new construction, including the differentiation between quantitative and qualitative additional demand and the calculated backlog, can be accessed and analysed in the empirica regio Market Studio.
Furthermore, vacancy forecasts are available at district level. The vacancy forecast is calculated based on the difference between the updated housing stock and the forecast demand. Both the demand for new construction and the vacancy rate are calculated separately for single-family and two-family houses as well as apartment buildings.