Housing Bubble Index Q3/2026: The bubble keeps deflating


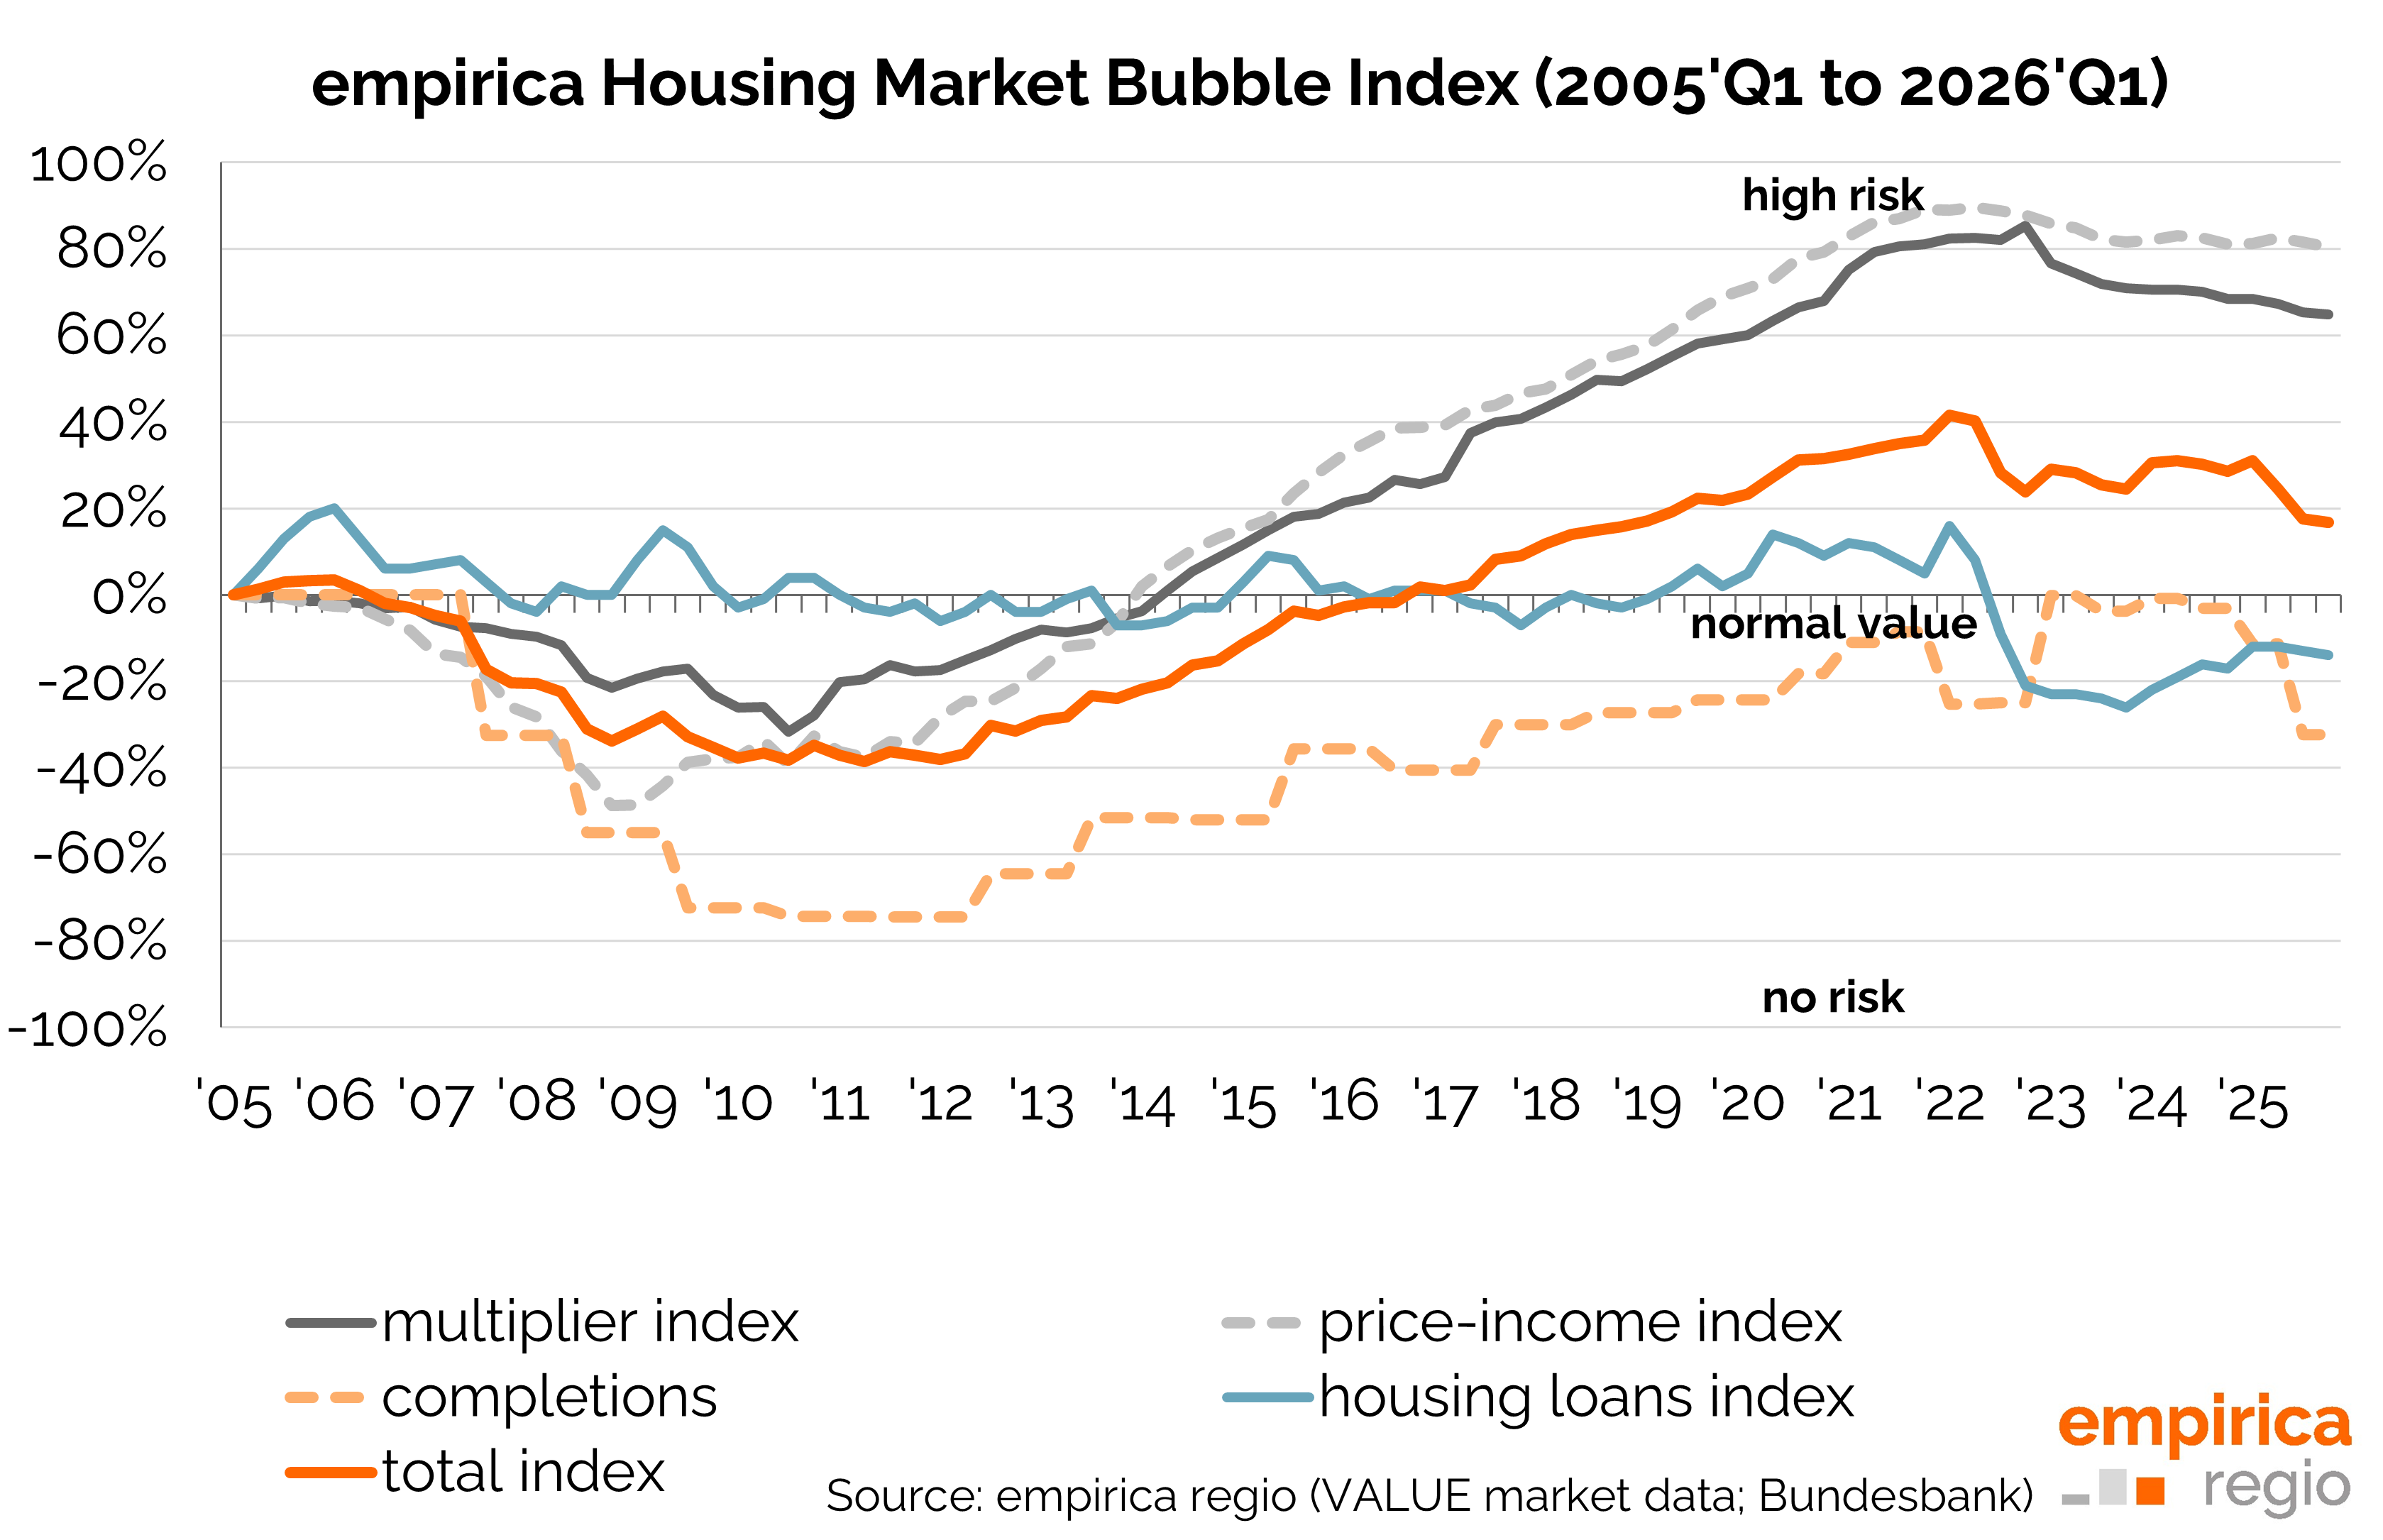
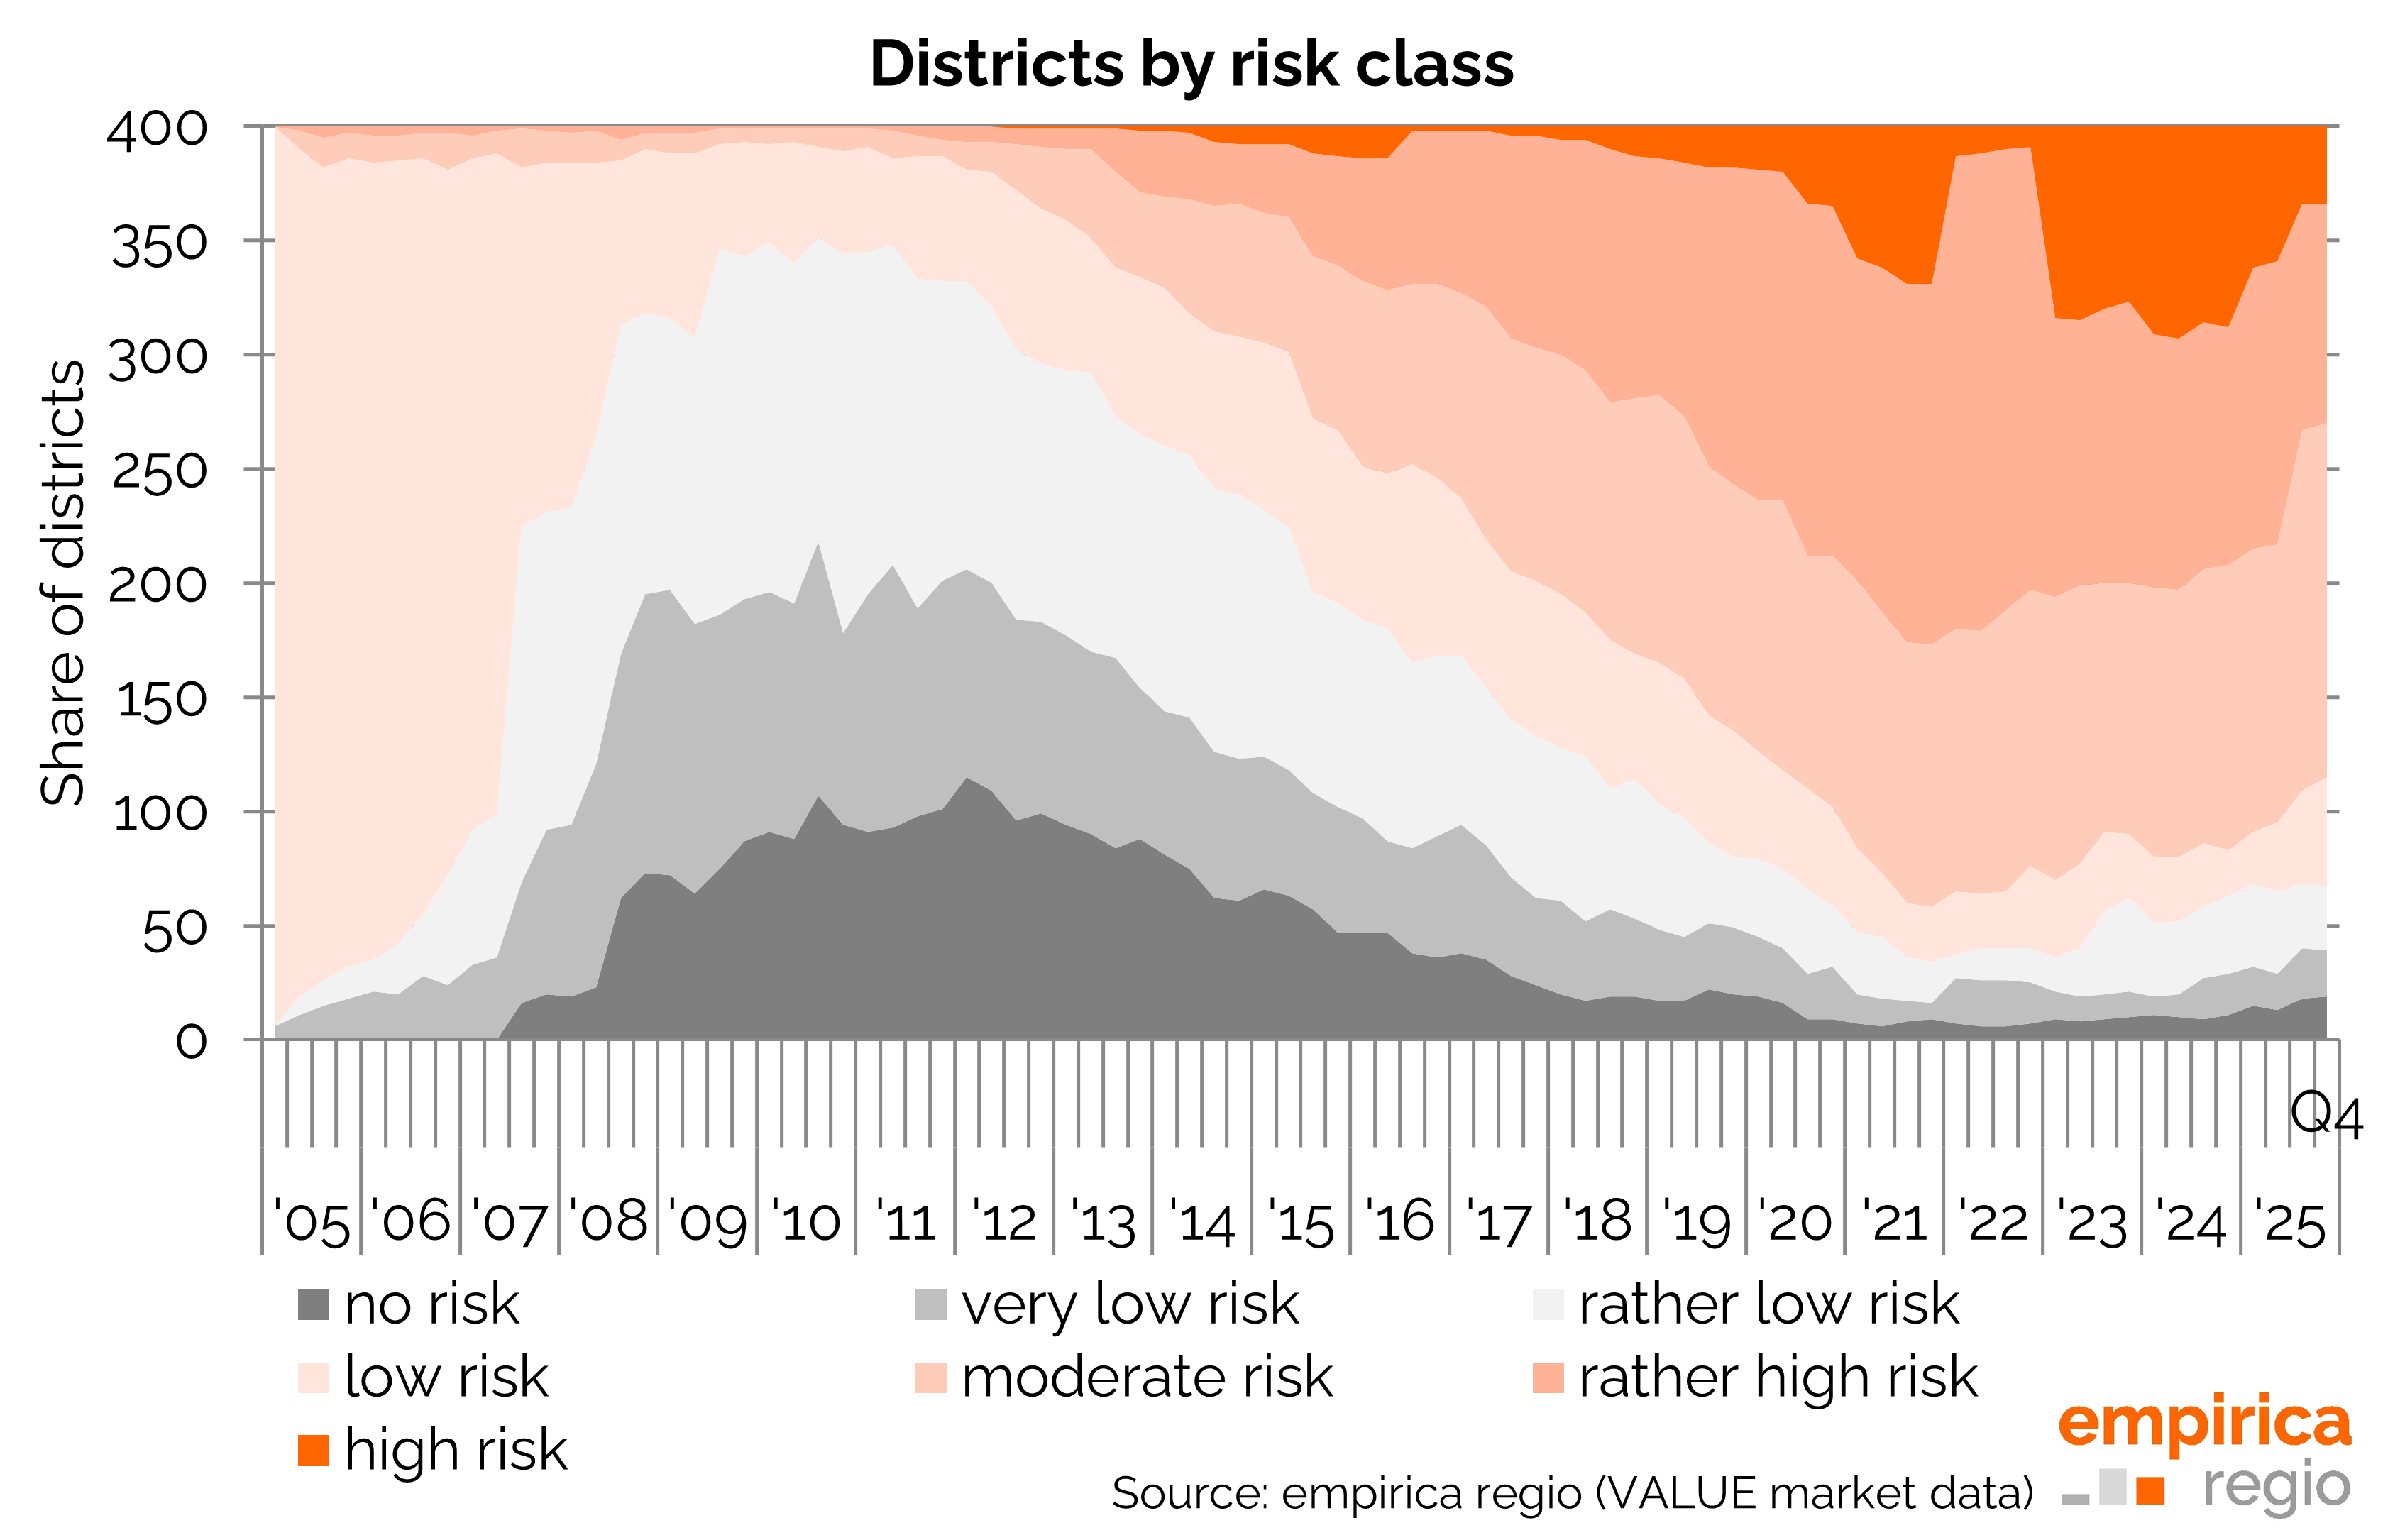
The severity of the housing market bubble risk continues to ease: the rebound potential now stands at just 17% nationwide (Q3/2025: 20%, Q3/2023: 23%), and at 28% in the top 7 cities. The trend towards a lower rebound potential was helped by rising rents alongside stagnating purchase prices. The spread of the bubble risk is falling sharply (-4 points), yet still affects 262 of 400 districts with moderate to high risk.
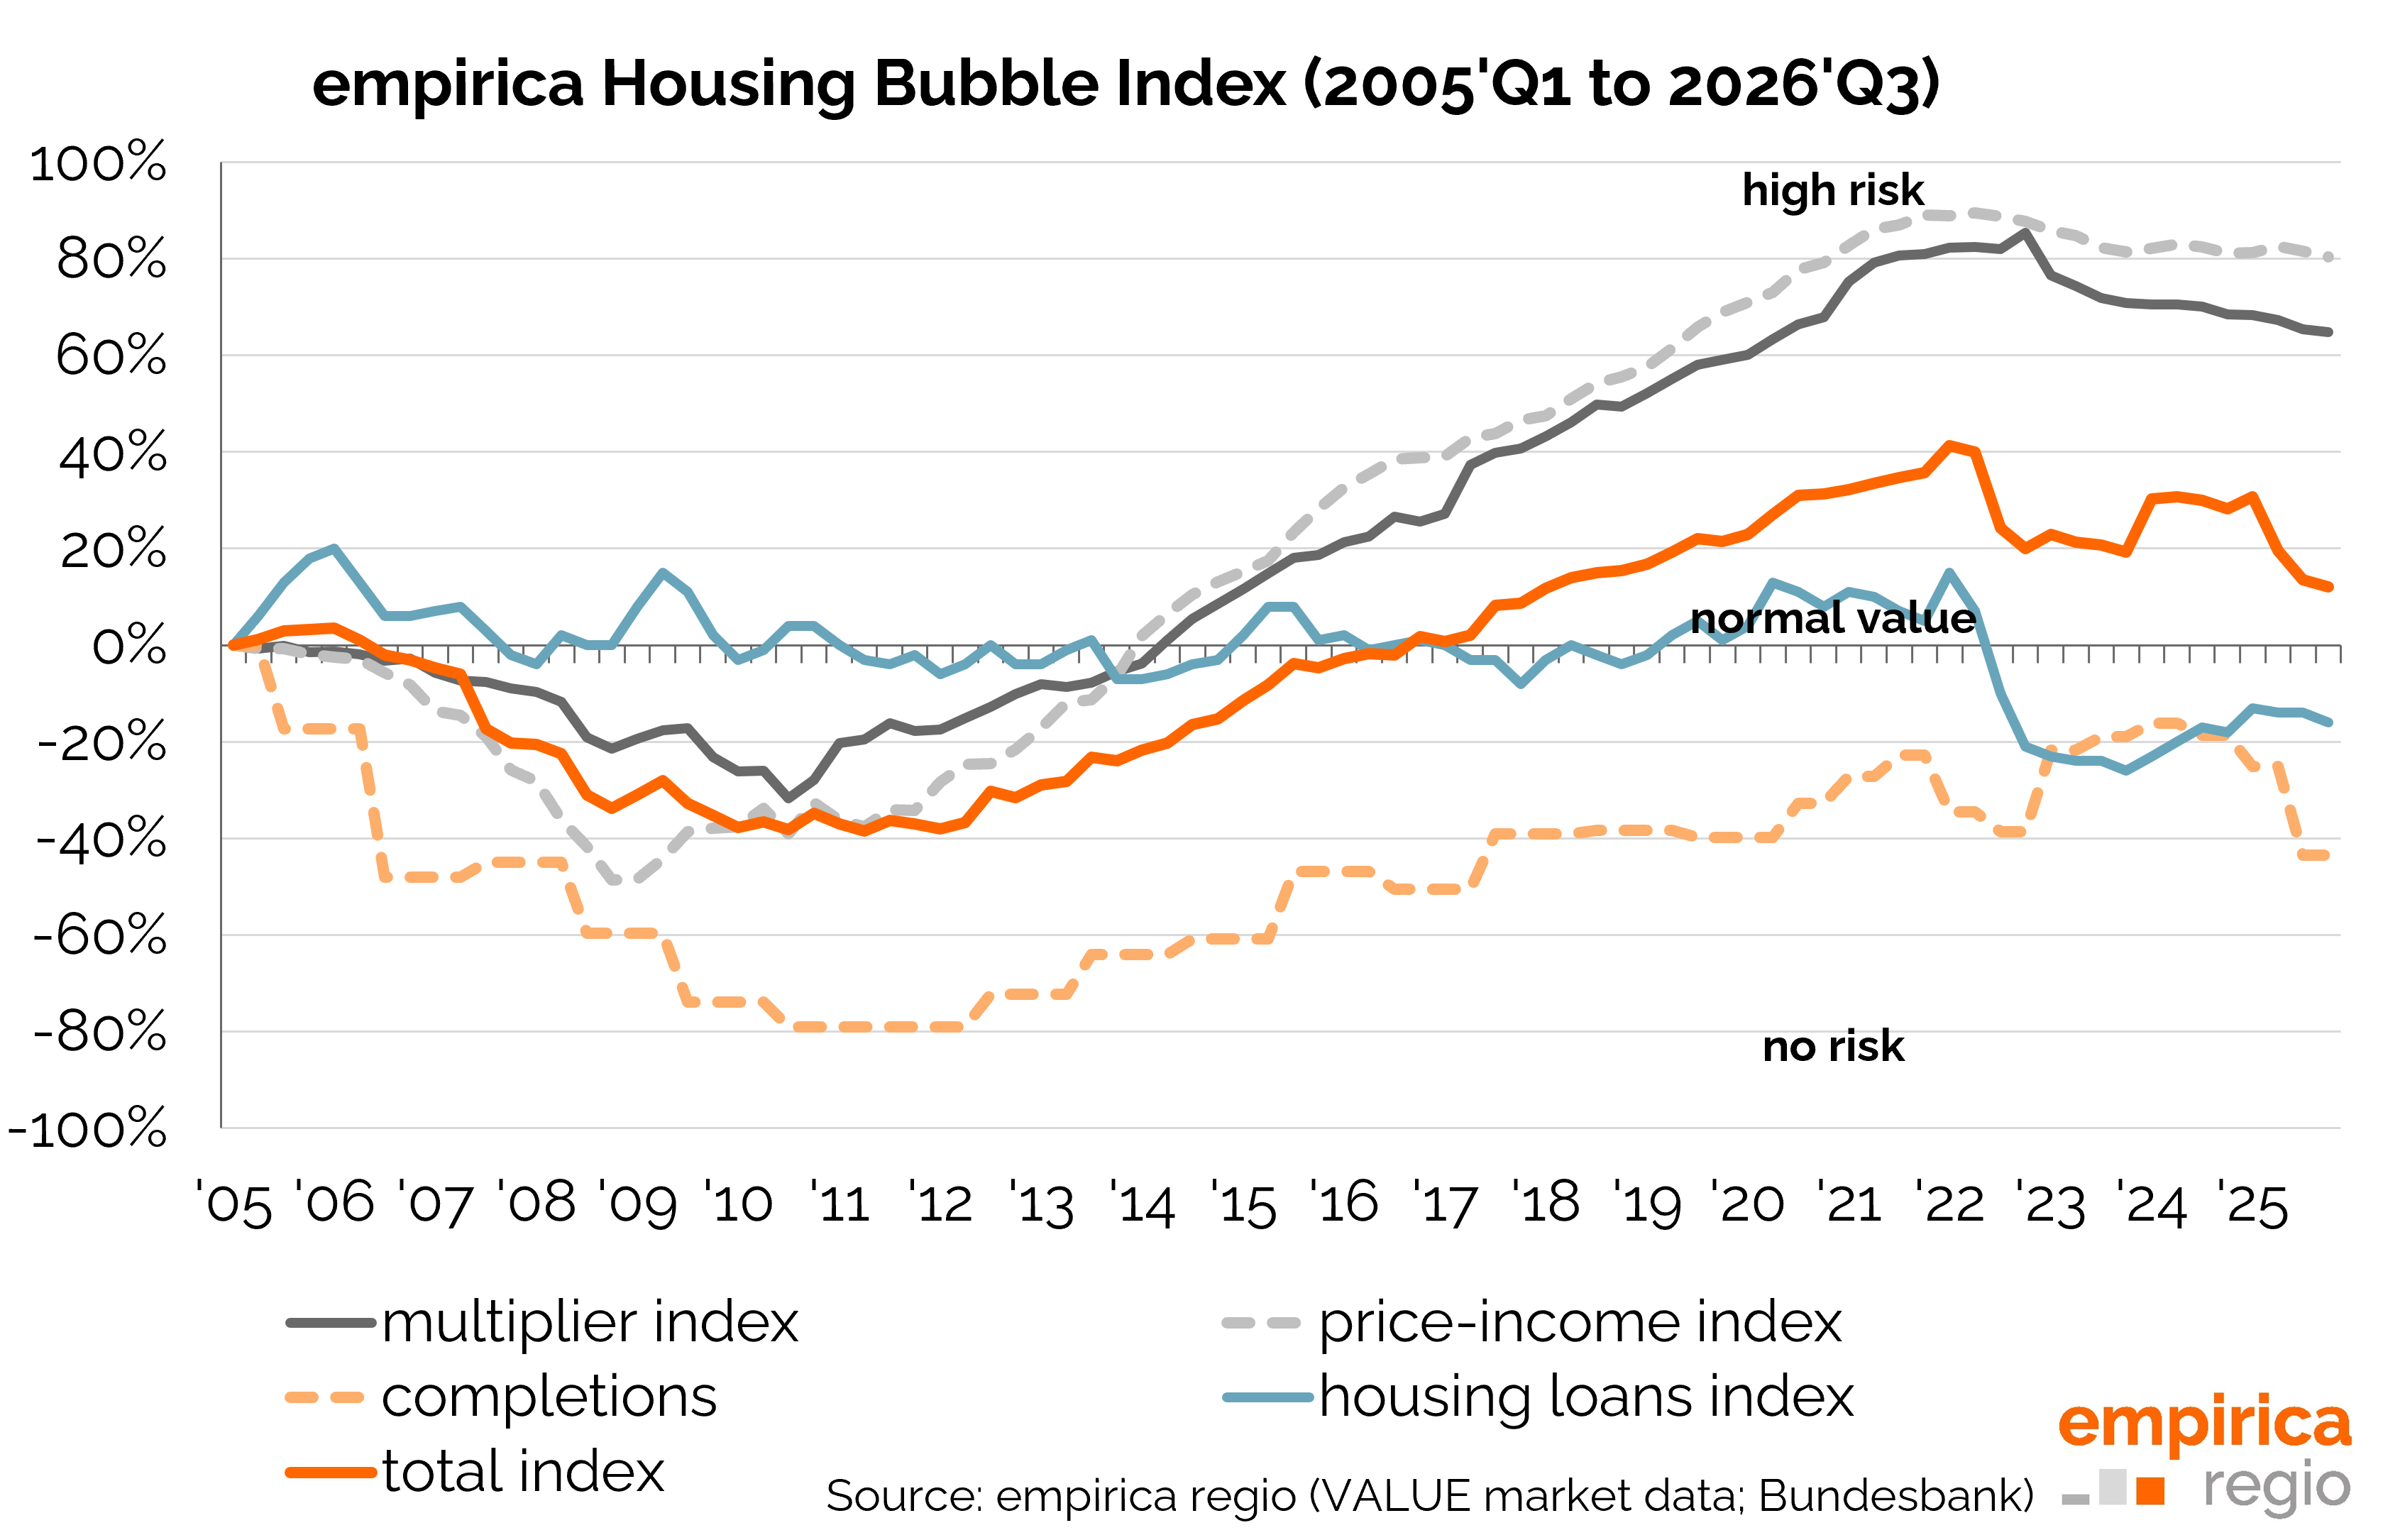
There is more movement across the four sub-indices than in previous quarters: the completions sub-index is falling sharply (-16 points), while the multiplier index and the housing loans index are easing slightly (-1 point each). The price-income index is rising (+1 point). The spread of risk also presents a calm picture: currently 48% of districts show a “moderate” bubble risk, a further 14% a “rather high” risk and 5% a “high” risk – well below the peak of 326 districts with moderate-to-high risk seen at the end of 2021.
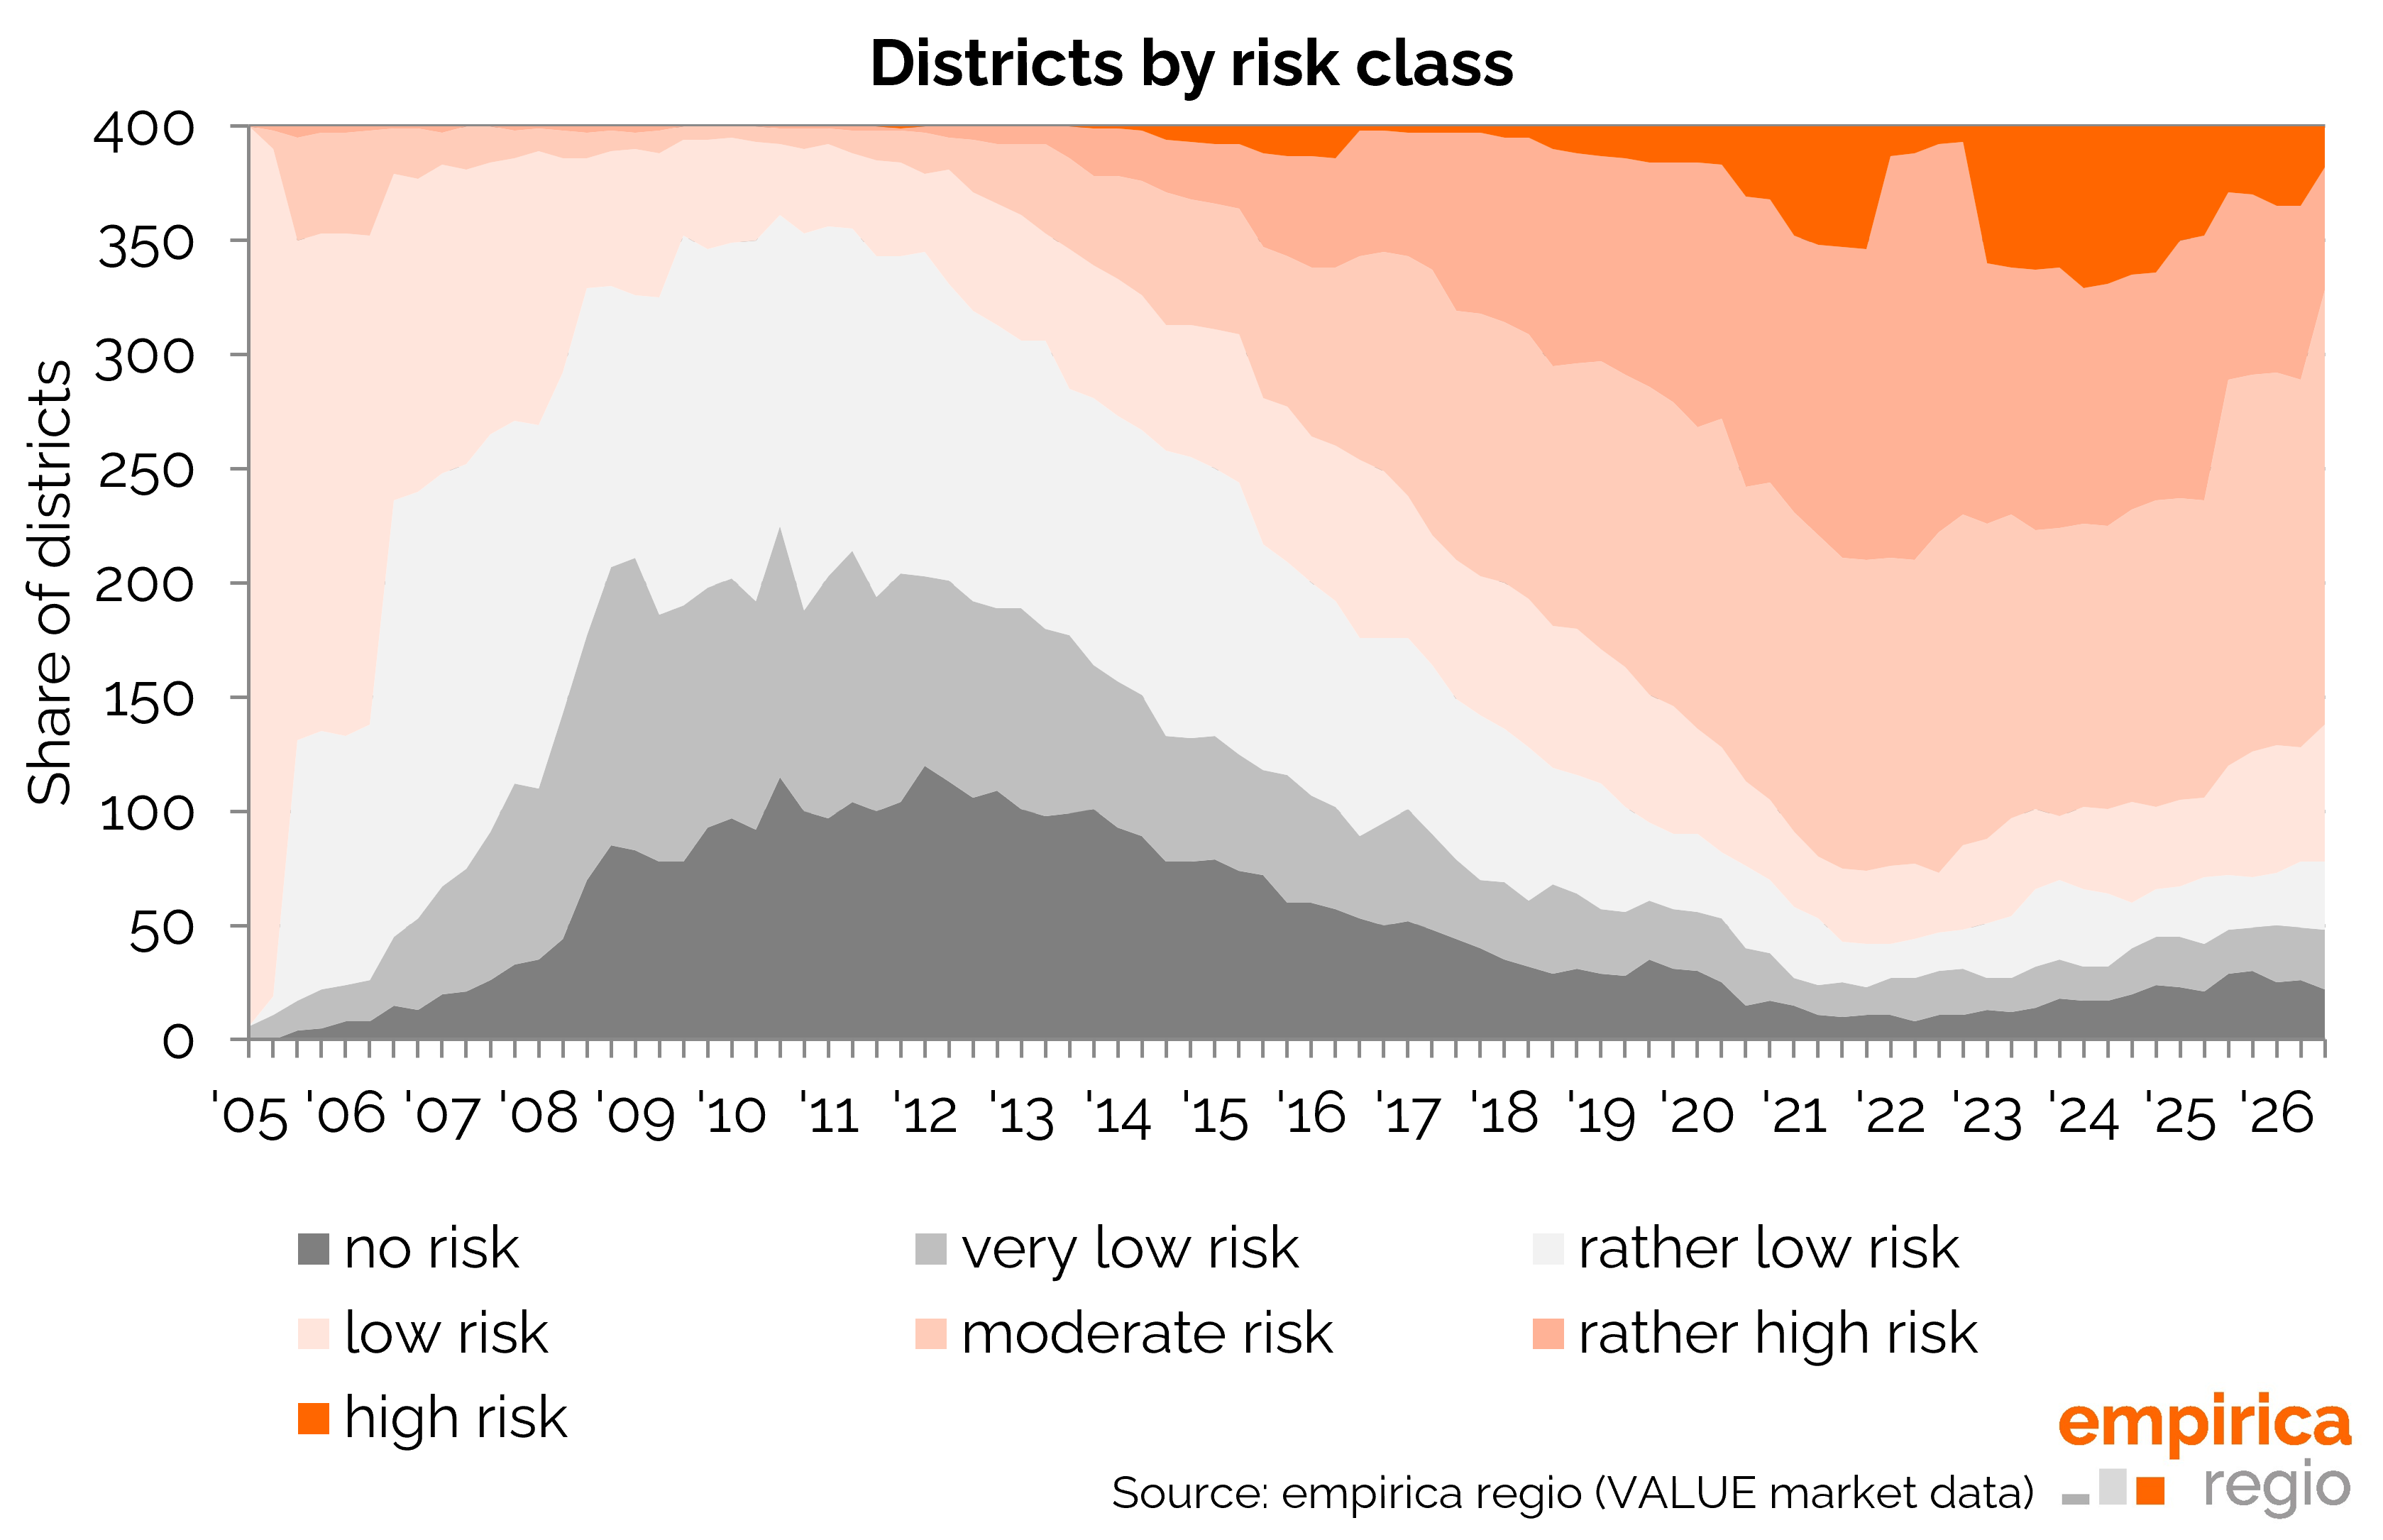
Among the major cities, a clear gradient emerges: Dortmund continues to show only a “low” risk, while Essen and Stuttgart are rated “moderate”. A “high” risk now exists only in Hamburg, whereas the risk in all other major cities is “rather high”.
Data basis Housing Bubble Index
The empirica housing bubble index is a quarterly index that assesses the risk of a property bubble in various regions of Germany. All data can be obtained as an individual dataset or via database access from empirica regio. Detailed results and further information on the methodology can be downloaded here:
The current commentary by Dr. Reiner Braun: The air keeps going out – why the bubble risk is falling while the crisis escalates
A property bubble bursts when overheated prices crash unchecked. The risk of this rises whenever purchase prices run away from reality and climb faster than rents – a phenomenon familiar from overvalued shares whose prices have risen completely decoupled from company profits. In the German housing market, however, this specific bubble risk has been all but history since 2022. The reason, though, is not healthy market growth but a brutal emergency stop.
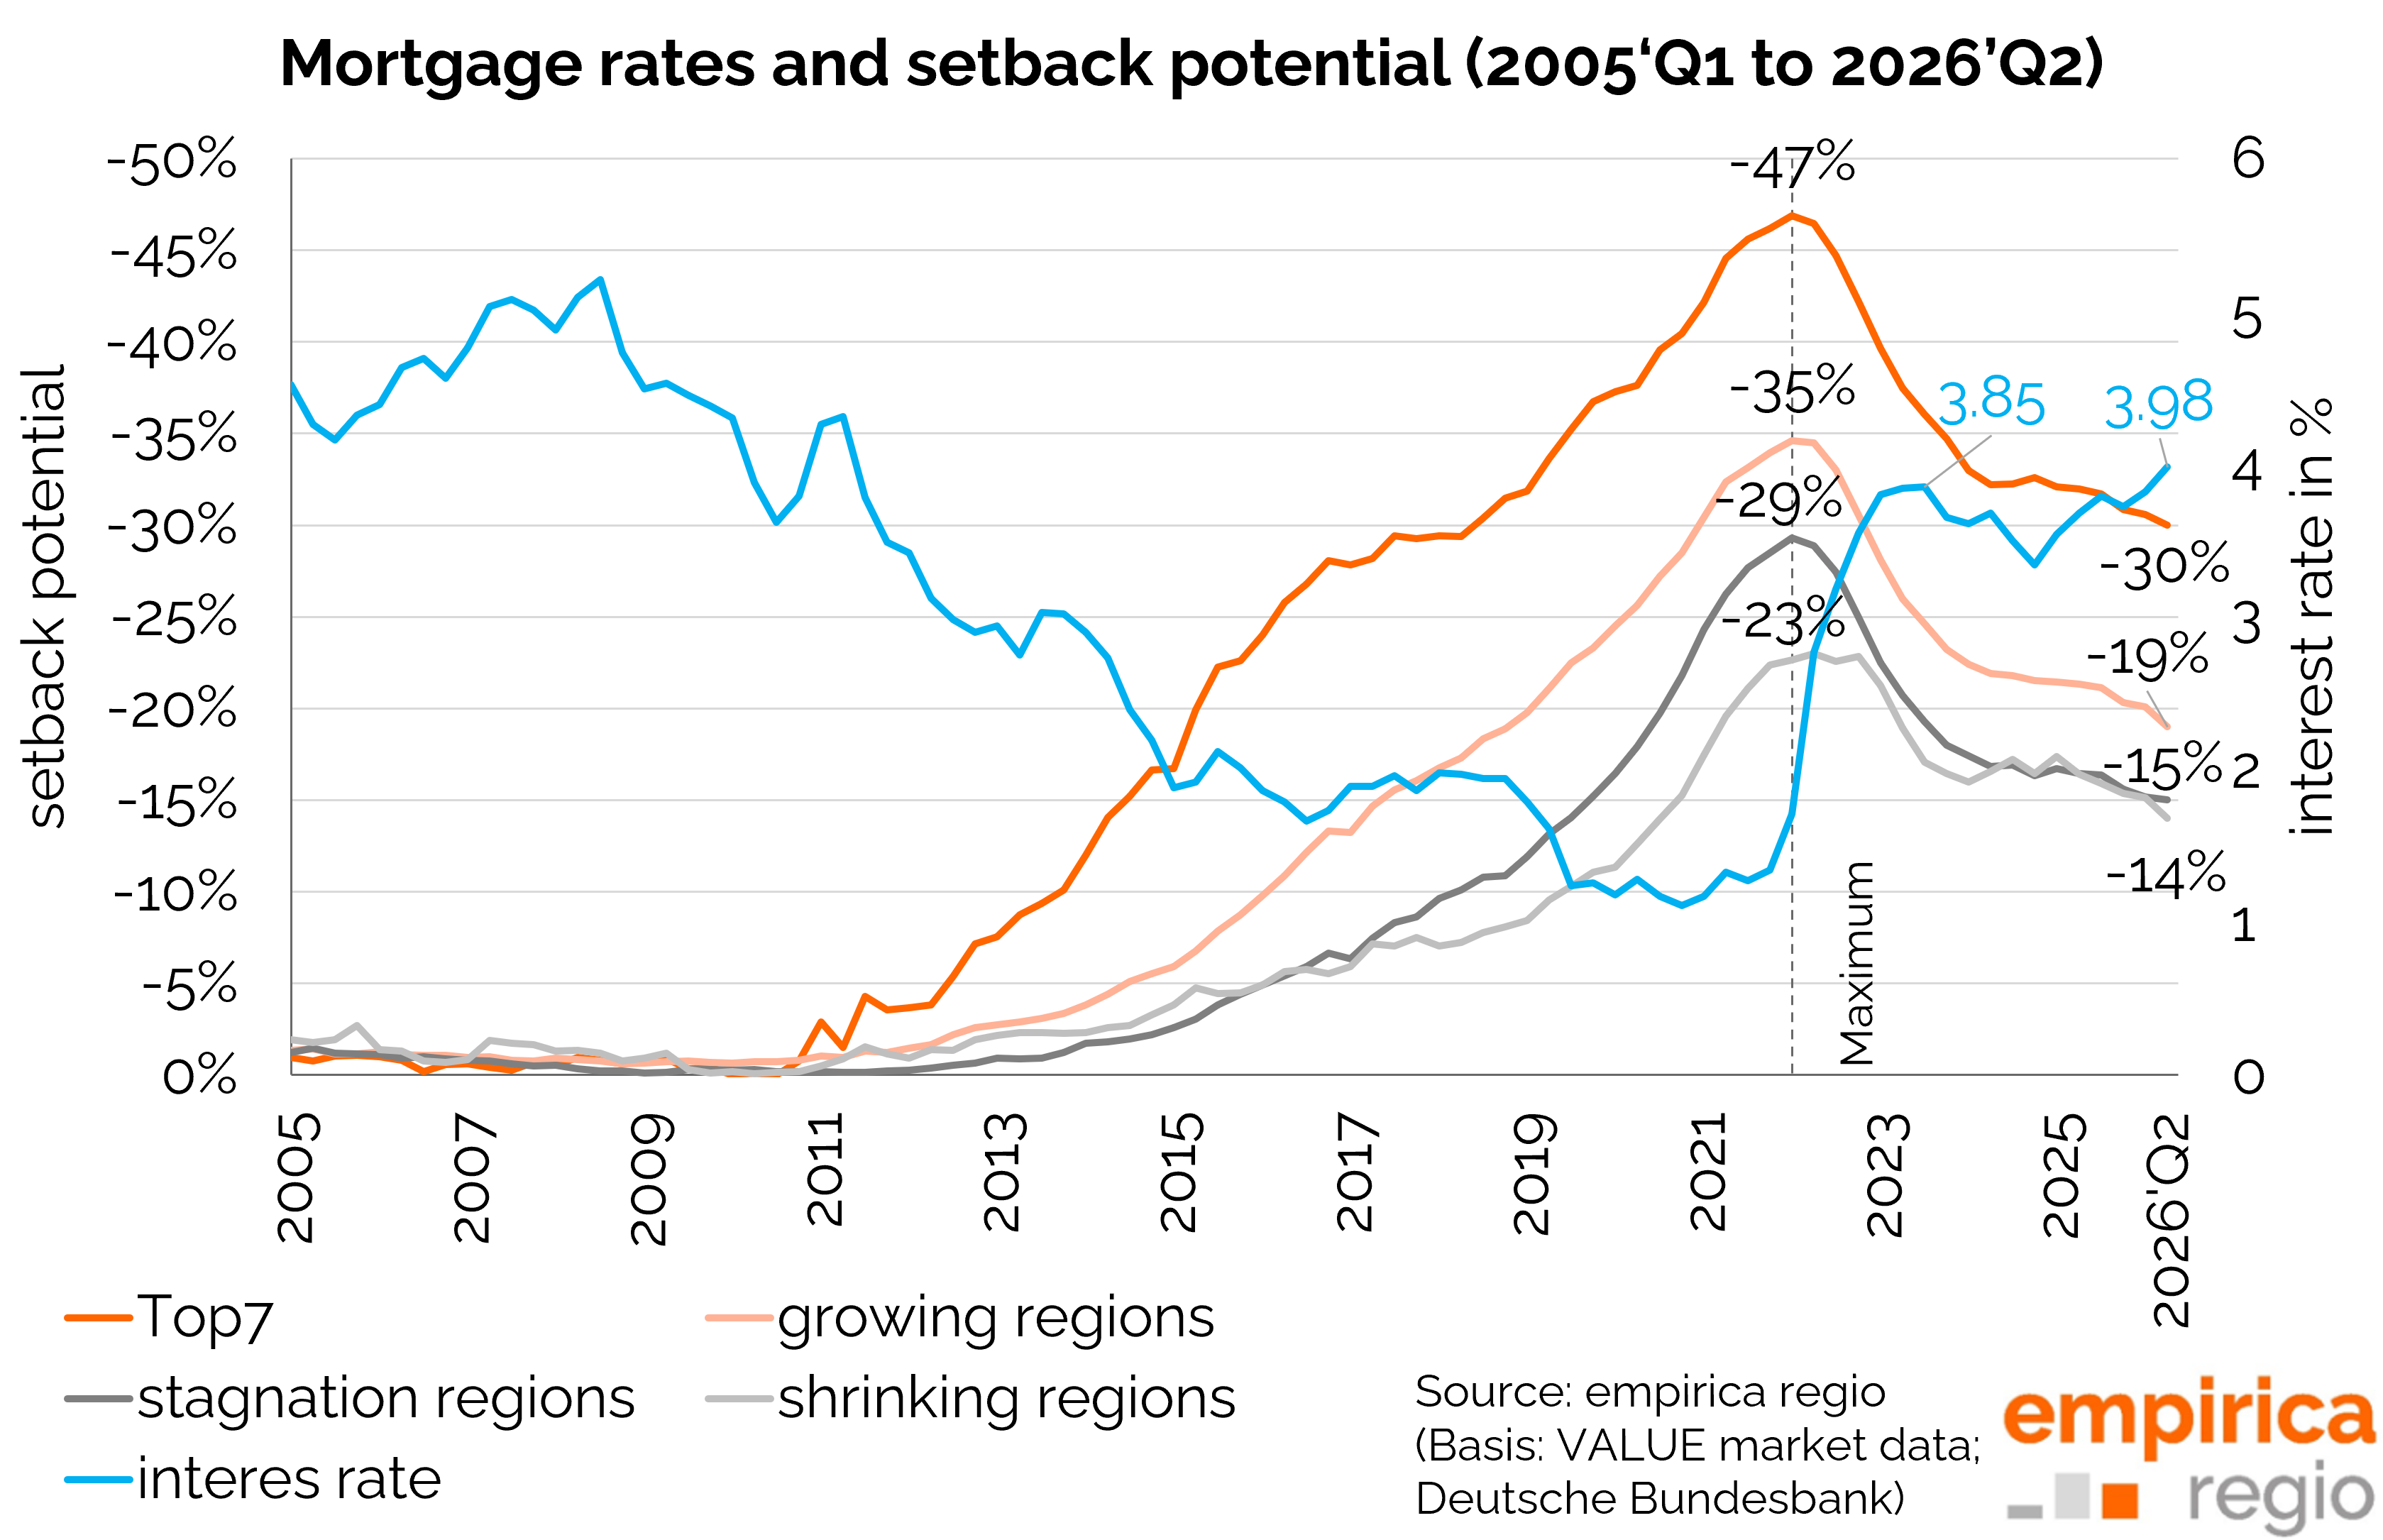
The historic rise in interest rates in recent years has pushed financing costs up so far that new construction has all but collapsed. The logical consequence: the already serious housing shortage has worsened further, pushing rents up even faster than ever before. At the same time, the interest rate shock pulled the rug out from under purchase prices for existing properties, because investments simply became unprofitable.
History is repeating itself – as predicted
Interest rates have once again made a considerable jump upwards. This reality shock has not yet reached advertised prices – hope rules here. Many sellers are desperately clinging to the “old inflated prices” in order to somehow get away with no more than a black eye. A fatal misconception: prices will sooner or later inevitably give way. As the housing shortage meanwhile worsens further due to the lack of new construction, the market’s merciless conclusion is: rents are exploding, prices for existing properties are collapsing, yet the bubble risk is falling – at least. The air is then likely to be out for good.
The political debate about expropriations acts like an accelerant in this already toxic environment. It compounds the problem at the expense of tenants. Capital is a timid deer: investors have long been giving a wide berth to locations where property rights are up for debate. The result of this misguided signal is foreseeable: new construction will slump even further, renovations of existing buildings will not go ahead, and prices for existing properties will slide further. In the end, it is those looking for a home who will pay the price for this policy: rents up, quality down.